
NEW! 2018 Mobile App Engagement Index
In the first half of 2018, the combined app revenues for the Apple App Store and Google Play broke another record with a 27.8% increase YoY.
As more app marketers push for their slice of this $34.4-billion revenue pie, our new 2018 Mobile App Engagement Index will arm you with the data you need for your holiday planning.
At 62 pages long, this year’s report draws from more data than ever. We analyzed 257+ billion impressions across 58M+ installs and 19M+ post-install events on the Liftoff platform and, for the first time, included retention benchmarks from our friends at Leanplum, a mobile engagement platform. Grab your digital copy now!
In the report, you’ll find engagement data and deeper-funnel metrics to help you answer critical questions:
- What is the average cost to acquire a user who installs an app, registers and makes an in-app purchase?
- What’s the average cost-per-install in APAC, EMEA, LATAM, or North America?
- When is the best time of the year to increase spend to take advantage of lower CPI and higher engagement rate?
Download the report to get the answers.
Mobile Engagement Benchmarks to Boost Your App’s Growth
2018 has been a great year for the App Economy. The massive growth of app supply coupled with the higher rate of mobile adoption worldwide means more competition – but also more money on the table for app marketers. The report highlights the benchmarks and trends you need to know to get ahead:
- Average CPIs, CPAs and post-install conversion rates
- Engagement trends by OS and gender
- Seasonal trends with MoM comparison of costs and conversions
- User acquisition trends in North America, LATAM, EMEA and APAC
- Fresh insights on Dating, Finance, Gaming, Shopping, Travel and Utility apps
- Retention data across regions, platforms and verticals
Seasonal Trends to Inform Your UA Strategy
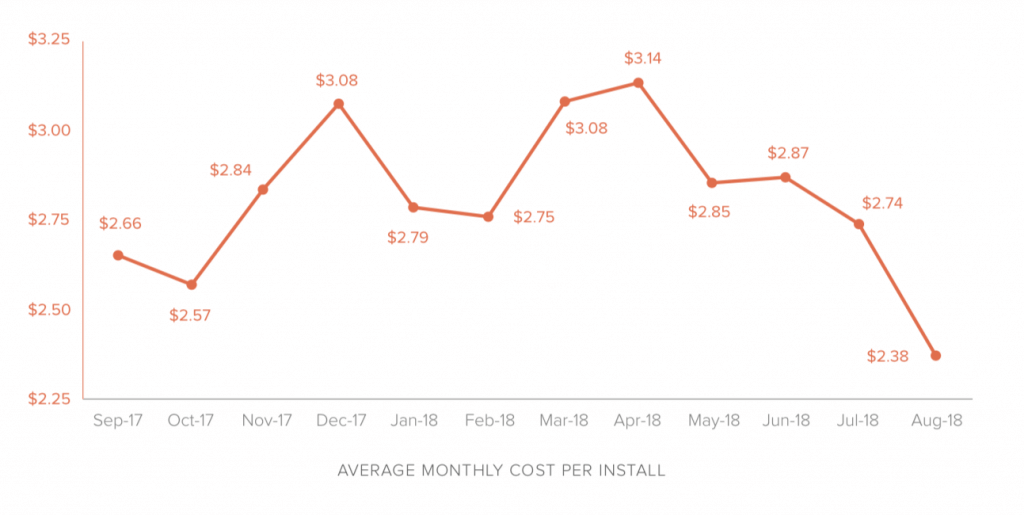
The report shows acquisition costs with conversion rates throughout the entire calendar year. Use this data to uncover exciting periods of opportunity and get the best value for your money. The Index shows stats for key revenue-generating actions such as Reserve and Purchase, plus expert analysis and commentary to help marketers understand trends.
Grab your free copy of the Index today!