
Why LTV Is Essential for UA, and D7 ROAS Should Be Retired
The following is an excerpt from an article by Ben Young on the AlgoLift by Vungle blog, “Why LTV is essential for UA, and D7 ROAS should be retired”. The full article can be found on the AlgoLift by Vungle blog.
In mobile UA, a common practice is to buy against ROAS (return on ad spend) targets based on revenue measured in the first 7 days after a user installs the app, i.e. D7 ROAS. D7 ROAS provides an early indicator of campaign performance that’s easily measured with the help of MMPs and campaign-level attribution. D7 ROAS is used primarily because it offers better insight into post-install performance than CPI or D1 ROAS. It also generally captures a large percentage of users who convert into payers or pass key event benchmarks early on.
D7 ROAS targets are often set based on the historical relationship between a cohort’s monetization at D7 and at the advertiser’s true payback window. For example, if historical cohorts have a D365 / D7 LTV ratio of 20, then the advertiser would buy against a 5% D7 ROAS target to hit a 100% payback at D365.
At best, these targets are continually re-calculated by UA teams as apps go through product updates and long term retention changes. At worst, the target is calculated once and slowly evolves into a magic number of unknown origin.
Why the current paradigm is inadequate
In reality, Day 365 and Day 7 LTV are not proportional, nor should one expect them to be. Let’s assess two cohort “LTV curves” from a top grossing mobile game:
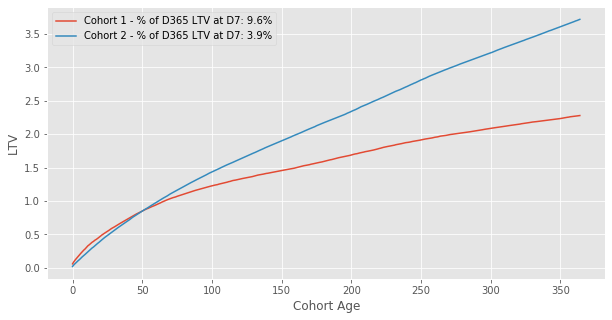
In this simple example, the red cohort shows a higher D7 LTV but worse retention and by D60, the curves cross. The red cohort spent 10% of its eventual D365 LTV at D7, while the blue cohort had spent only 4% and so percentage-wise had more of its future value to come. The red cohort had a higher D7 LTV but much lower D180 and D365 LTV. This is a good example of D7 failing to represent long term value.
Only when cohorts exhibit identical retention and purchase rates over time could we expect a D7 payback % to be constant. In reality, different cohorts have different retention rates and their LTV curves differ in shape. This is especially true when comparing cohorts across different media sources or campaign types, which may fundamentally differ in behavior.
Increasing the number of multipliers based on the cohort performance partially solves for the incorrect prediction. However, this quickly becomes complex as the team now has many different ROAS targets across networks. This leaves no solution for newer channels or those with limited history. Furthermore, the multipliers are still not static at a channel level, and changing campaign structure can quickly change the possible retention curves. Conditional multipliers are a clumsy half step toward solving the problem.
Read the full article here.
Learn more about AlgoLift by Vungle’s solutions by contacting us below.