NEW! 2018 Mobile Gaming Apps Report
Whether the goal is to get the most mileage out of a F2P model, or to monetize their games through advertising that matches their audiences, app marketers require insights around the activities, opportunities and events that will allow them to acquire and engage audiences that are both high-value and highly profitable.
This is where the 2018 Mobile Gaming Apps Report comes in. The report draws from Liftoff internal data from June 1, 2017, through May 31, 2018—spanning nearly 47 billion impressions (46,776,245,374 to be exact) across over 658 million (658,586,911) clicks and over 15 million (15,358,421) installs. In addition to tracking costs and engagement metrics across the entire Gaming funnel, the report also breaks down data by platform (iOS and Android), user demographics (gender) and region (APAC, EMEA, LATAM and North America).
But the real attraction is a comparison of data across a variety of gaming categories (Casino, Casual and Strategy) accompanied by a deep-dive into how app marketers can harness rewarded video as an effective monetization tool.
App marketers up their game
Lower costs and higher engagement rates are a positive and promising development that spells opportunity for app marketers determined to drive engagement deeper in the funnel. For example, the cost to acquire a user who completes a registration ($6.88) is 23% less than the previous year ($8.94), while engagement rates at that stage show a 20% increase. Read this as a sure sign that users understand and appreciate gaming apps and respond to their advertising campaigns–and consider it a green light to use other channels (messaging, email and modal messaging) to clinch the deal.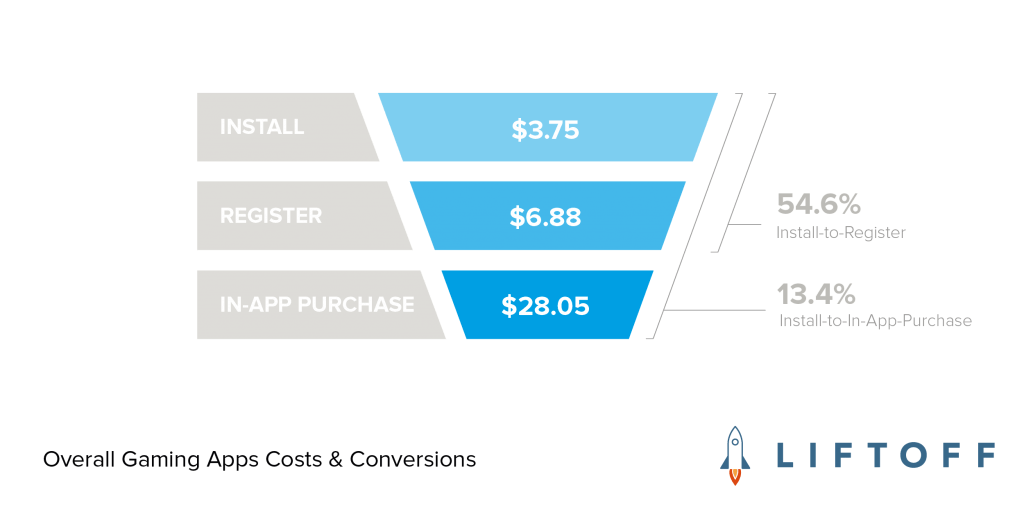
Of course, purchase is always the prize, and data around in-app purchase costs and conversion rates shows that app marketers are hitting the mark. What appears to be a modest engagement rate at 13.4% represents a massive 67% increase over the previous year. Overall, the cost to acquire a user who completes an in-app purchase is almost a bargain compared to the price tag in 2017.
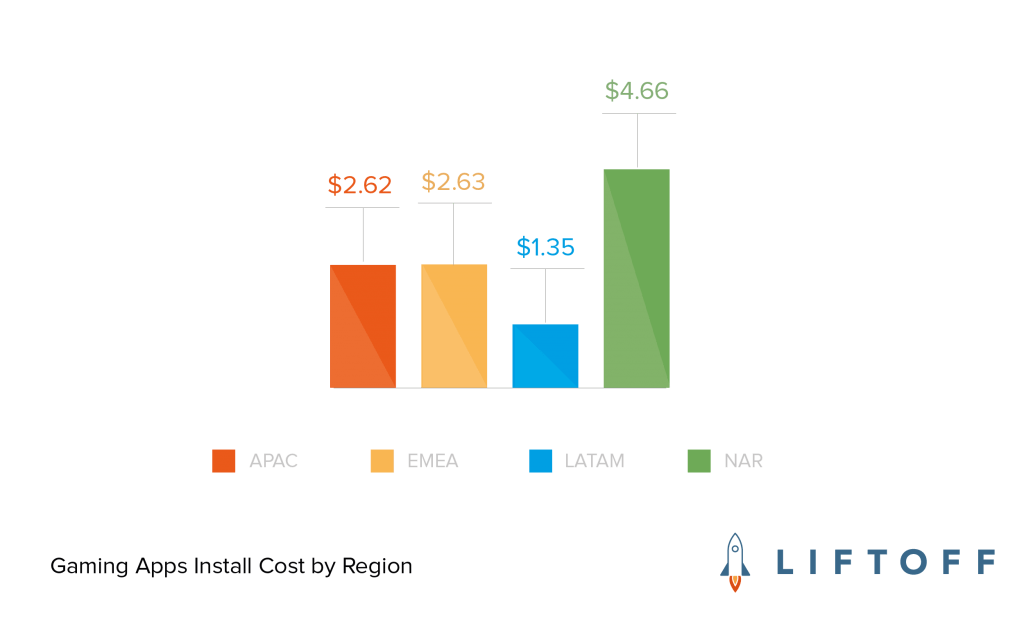
Where and when to fish
App marketers are inclined to “fish where the fish are”—and that’s why North America has traditionally been the key market for gaming apps. However, app marketers should also be encouraged to explore the promise and potential of markets in APAC and EMEA. At $21.42 the cost to acquire a user in North American who makes an in-app purchase is moderately higher than the cost in EMEA ($16.53). But it’s an outright steal compared to the massive $71.02 price tag attached to users in APAC.
So, what are the best times of the year when you can drive positive results without draining budget? One month that stands out is October when app marketers can buy low ($20.32 IAP) and engage high (17.0%). But don’t limit yourself. Mobile gaming apps are an always-on passtime and passion, so it pay to do more to drive more engagement all year long.
Where to place your bets
Strategy, Puzzle and Casino lead the list of popular gaming app categories, which is why the report breaks down data by acquisition costs and engagement rates for each. The data reveals interesting patterns that tell an even more exciting story. Games subcategories with a clear value proposition or call-to-action appear to have the advantage. A prime example is Casino games, a subcategory players pick because they want to win. This might explain why costs are moderate across the gaming funnel, and the install-to-purchase rate for this subcategory leads the group with an impressive 17.3%.
Ad formats that convert players into payers
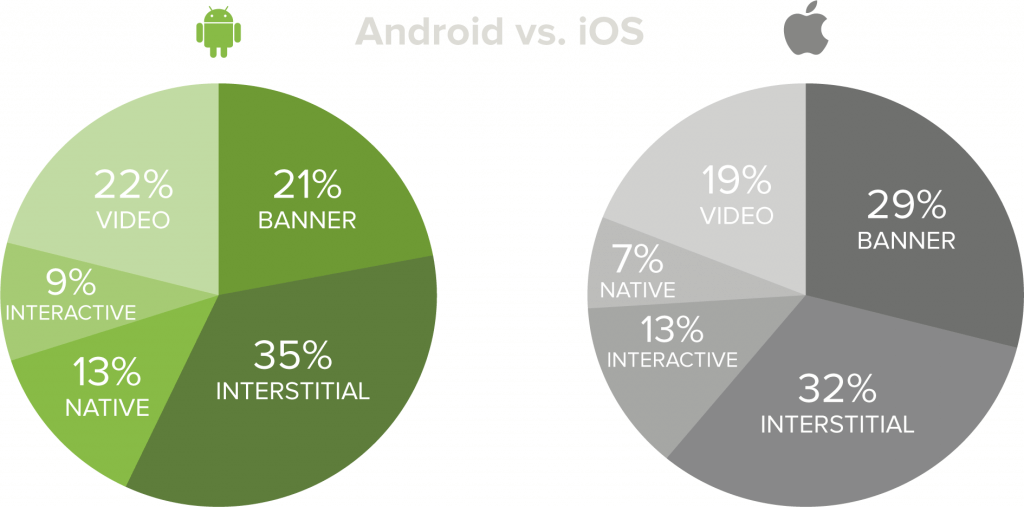
For the first time, Liftoff examines gaming ad spend by format showing that app marketers focus the majority of their spend on static formats (banner and interstitial).
Expect video and interactive advertising to make a land grab, driven by its ability to make experiences immersive and memorable. Liftoff data indicates app marketers are becoming more aware of the opportunity, which is why these two ad formats already count for 31% of ad spend on Android, and 32% of ad spend on iOS.
Download the 2018 Mobile Gaming Apps report for a deep dive in these stats plus a break down of data by platform (iOS and Android), user demographics (gender) and region (APAC, EMEA, LATAM and North America).