![]()
2019 Japan Mobile App Engagement Report
User Acquisition Trends
and Benchmarks
Contents
Key Takeaways
-
A review of CPIs reveals Gaming, Finance and Dating are categorieswhere marketers might find a bargain. CPIs for Entertainment apps, up a massive 86% compared to the previous year, and Shopping, up 19.3% from the year before, suggests these are the categories where marketers expect to face the toughest competition and the highest costs.
-
Deeper in the funnel, Dating, Entertainment and Shopping apps users are pricey to acquire, but conversion rates are promising. Finance apps users are a bargain with enormous potential, while conversion rates for Gaming apps users have plummeted. Utility apps are linked with moderate costs and conversion rates.
-
An examination of retention shows Japanese users are loyal for longer and download apps with a purpose. Double-digit retention rates for most apps (except Dating) from Day 1 through Day 30, indicate users are dedicated to their favorite apps and convinced of the value they offer.
-
A breakdown of app session data over 30 days shows Gaming dominates time spent in apps. It’s a similar situation with Shopping apps, the category that comes in second place. While the number of sessions for Entertainment apps is at the low-end of the spectrum, the time spent is impressive, indicating it’s a category with audience appeal and growth potential.
-
Seasonality is a factor that impacts acquisition costs and cost-per-action. Registration is the engagement stage where app marketers can buy low and engage high. May, June and July stand out as stellar months when marketers can acquire highly engaged users at a reasonable cost.

Introduction
State of Japan
Home to a population of 126 million and ranked as the 4th richest country, according to the World Bank, the Japanese mobile market has existed longer than any other worldwide. Some 20 years ago — before apps, app stores, and smartphones — audiences were able to download games to their feature phones from the NTT DoCoMo platform and are primed to pay for the privilege. This explains why Japan consistently ranks among the “Big Spenders” of the App Economy, accounting for 15.4% of global app revenues in 2018.
Almost half (46%) of Japan’s mobile gaming app users are willing to spend on the games they like, according to joint research from Newzoo, a research firm providing market intelligence for games, e-sports, and mobile, and Mintegral, an advertising platform with a focus on the APAC market. The companies peg the annual spend per player in 2018 at $371, nearly 3.5x that of the U.S. While revenues generated from mobile games in Japan were almost 5x more than those from non-games, it’s the latter category that has the more promising outlook for future growth. Specifically, the non-gaming app market is growing at 14.3% per year, compared with the mobile games market, where the growth rate has slowed to 4.8%.
Yet Japanese users have been slow to embrace mobile commerce, a phenomenon closely linked to the country’s demographics. Japan is “the most-aged nation in the world,” where 28.8% of the population is 65 or older. At one level, the partiality of senior citizens for low-end feature phones leaves Japan trailing behind its neighbors in smartphone penetration. According to the latest media usage forecast from research firm eMarketer, the number of smartphone users in Japan will reach 72.5 million, or 57.6% of the population, up just 2.4% from the previous year. Another hurdle is mobile data plans, which are significantly more expensive in Japan compared with other countries in the Asia-Pacific region.
At the other end of the spectrum, the preference of most users (not just senior citizens) for cash transactions has slowed the advance of mobile shopping apps and mobile banking apps. However, user behavior is expected to change rapidly as new legislation, part of the government effort to reduce Japan’s high cash use, paves the way for fintech apps to make their mark. Another factor with massive repercussions for mobile and apps is the determination of the government to be 5G-ready in time for the 2020 Tokyo Summer Olympics. Higher bandwidth is expected to spur consumers to do more (and spend more) using mobile apps.
The power and potential of Japan is supported by its impressive Growth Score, a metric developed by Adjust, the leading mobile measurement company. The metric, which divides the number of app installs per month by the monthly active users (MAU) for each vertical in the company’s data set, reveals the rate of growth for a mix of major app categories. A high score confirms an influx of new users — and Adjust data shows several categories (notably Games, Social and Entertainment) have reached respectable levels.
Growth Index by Vertical

To define growth, we took the number of installs per month and divided them by monthly active users (known as MAU) for each vertical and country in our dataset. This tells us the rate of growth that apps receive from installs against their monthly active user base. The more users that install in relation to the MAU, the higher the score.
Market conditions are clearly favorable for app growth, but marketers will have to do their homework to rise above the noise and convert Japanese users who prefer quality apps and partial to home-grown innovation. Think of this report as a starting point to a roadmap, one that will allow you to plot a growth path and achieve success in Japan’s exciting app economy.
Methodology
-

Apps Analyzed
177
-
Date Range Analyzed
1 Aug 18 – 31 Jul 19
-

Clicks
207M
-

Impressions
16.4B
-

Installs
3.0M
-
Post-Install Events
2.7M
Mobile Engagement Benchmarks by
App
Category
The growth of Japanese mobile commerce, the advance of mobile payment methods and the strong passion of users for apps that squeeze the most out of every minute have created positive conditions for increased app exploration and use. But increased engagement comes at a price.
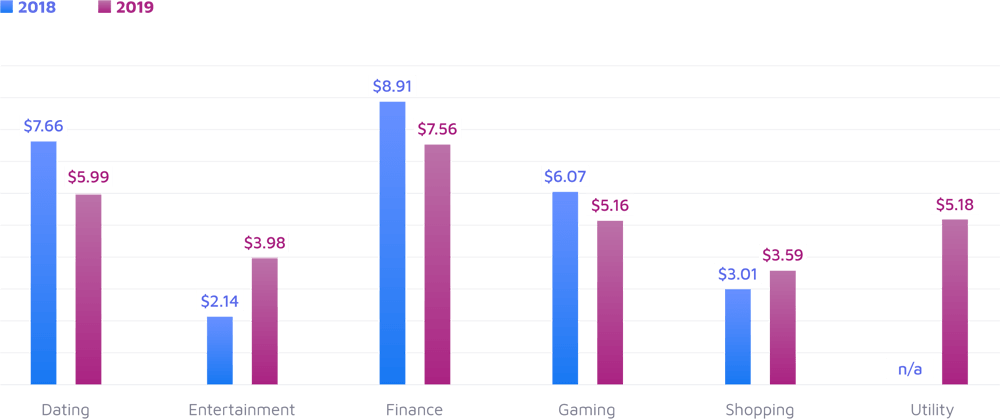
Average Cost-Per-Install by App Category
-
At $3.98, the cost to acquire a user for an Entertainment app (up 86% from the previous year) is a massive increase.
-
At $3.59, the cost to acquire a Shopping app user (up 19.3% from the previous year) suggests Japan’s love for shopping is shifting to mobile, a trend likely to pick up momentum and drive up CPIs.
-
At $7.56, the cost to acquire a Finance app user (down 15.2% from the previous year) is a golden opportunity in a country determined to increase cashless payments and pave the way for fintech innovation.
-
At $5.99, the cost to acquire a Dating app user (down 21.8% from the previous year) suggests these users are no longer playing “hard-to-get.” The increased interest of time-strapped users in apps that streamline the search to find a partner has removed the stigma and resulted in more reasonable CPIs.
-
At $5.16, the cost to acquire a user for your Gaming app (down 15% from the previous year) isn’t cheap, but the long-term loyalty of users to games they love is an added bonus marketers should keep in mind.

Confidence in Dating Apps is Rising, but Marketers Need to Win Trust
In Japan, busy singles are turning to apps to find love. Their inclination to pursue kosupa (cost-performance) in all life management tasks (including finding a soulmate) explains why the dating app market is projected to more than double to ¥57.7 billion ($547.4 million) by 2022, up from ¥20.8 billion ($197.3 million) in 2017. Now it’s up to marketers to turn interested users into committed subscribers.
Dating Apps: Cost & Engagement Rates

-
The cost to acquire a user who will commit to a subscription isn’t a steal at $110.16. However, the price tag, which is down 8.9% from the previous year ($120.96), suggests users are prioritizing apps in their search for a partner.
-
The install-to-subscription rate of 5.4%, down an alarming 8.9% from the previous year (6.3%), suggests marketers must do more to build trust in the value their apps offer.
-
But it’s not an uphill battle if marketers cater campaigns to the vast population of unmarried men and women (growing by double-digits compared to a decade ago). The impressive install-to-register rate of 58.4% (down a mere 1.52% from the previous year) confirms a strong momentum that smart marketers can monetize.

It’s Early Days for Entertainment Apps
Japan’s aging population may stay true to old habits, but that is changing fast as the country reverses laws that blocked the progress of video streaming — just in time for the Tokyo Summer Olympics starting in 2020. The release of entertainment content also coincides with a massive shift to smartphones and apps, the platform that accounts for 84% of internet time on apps, according to 2019 data from Nielsen NetRatings Japan.
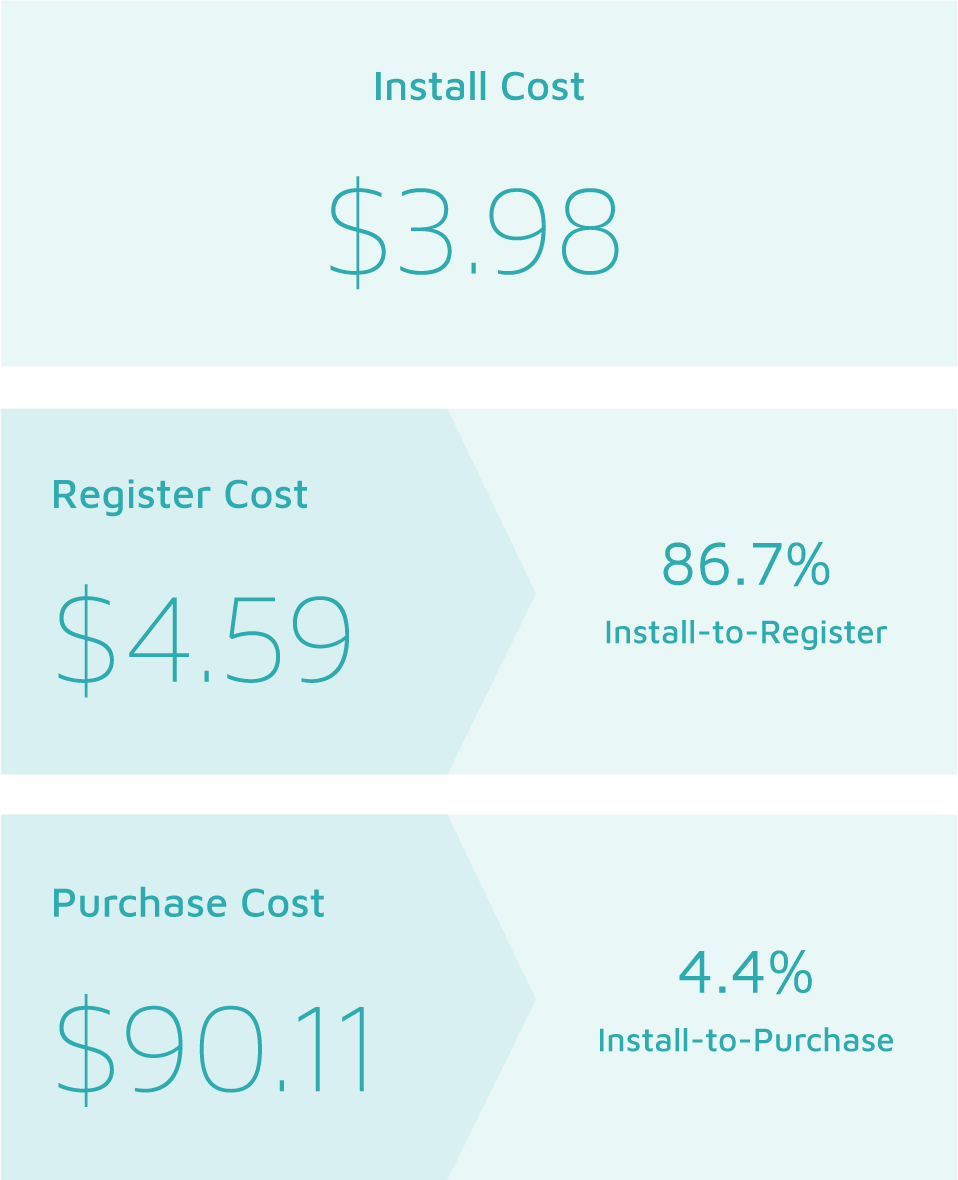
Entertainment Apps: Cost & Engagement Rates
-
An examination of the cost to acquire a user who goes on to complete a registration suggests the competition for audience, no doubt fueled by expansion and spend from streaming giants such Amazon Prime (currently the market leader, according to the Asia Video Industry Report 2019), will escalate competition for eyeballs and audience.
-
The install-to-registration rate of 86.7% (up 15% from the previous year) is positive, and a clear indication that users are eager to access entertainment and could also buy into a recurring subscription if the offer — and content — is right.
-
Deeper in the funnel, the cost to acquire a user who subscribes to a service is pricey at $90.11. Moreover, a modest conversion rate of 4.4% suggests a disconnect between the rising interest of users in entertainment on their terms and the effectiveness of campaigns to cash in on this trend.

Competition Heats Up for Finance App Users
The government push for mobile payments and cashless transactions is moving mobile finance apps into the spotlight. About half of Japan’s 1,400 banks are set to join a nationwide smartphone payment service that will allow users to register their bank information and make a purchase. But competition for users is sure to heat up as new fintech entrants, such as LINE Kakeibo (a financial account and personal asset management service app) and India’s Paytm (a collaboration with Japan’s SoftBank and Yahoo Japan) target consumers warming to the idea of managing personal finance and purchase via smartphone.
Finance Apps: Cost & Engagement Rates

-
At $23.26, the cost to acquire a user who completes a registration is 12.53% higher than the $20.67 price tag reported for the APAC region in the 2019 Liftoff Mobile Finance Apps Report.
-
However, a comparison with other regions covered in the report (EMEA: $26.51 and North America; $46.86) shows Japanese users are a bargain with enormous potential.
-
At 32.5%, the install-to register rate in Japan is also what you would expect in APAC, a region that leads the way with a conversion rate of 33.6%.

Gaming Apps Excel, but Marketing Needs a Refresh
Japan is a dream-come-true market, where 46% of players are payers. What’s more, the average revenue per user (ARPU) in Japan (pegged at $90.25 in 2017) is more than 3x the world average of $30.64. However, the wane of blockbuster titles (perhaps compounded by stale marketing campaigns) has made ROI a challenge for local developers. This negative trend, combined with the clampdown on gaming licenses in mainland China, has created an unsettling dynamic that pits both Japanese and western developers against Chinese games publishers. According to data from mobile market intelligence provider Sensor Tower, 16 mobile games from Chinese publishers entered the ranks of Japan’s top 100 best-selling mobile games in the first 3 months of 2018. Chinese companies continue to expand, tapping plentiful capital and aggressive marketing campaigns to make their mark.
Gaming Apps: Cost & Engagement Rates

-
At $103.31, the cost to acquire a gaming app user who makes an in-app purchase has entered the 3-digit realm, a development that turns up the pressure on marketers to drive results. (The cost for this engagement activity is up 22.7% from $84.23 the previous year.)
-
The install-to-in-app-purchase rate has plummeted by over 30% to hit 5% (from 7.2% the previous year). It’s a decline that suggests marketing campaigns (and possibly product) are ripe for a refresh.
-
Japanese users are the industry’s biggest spenders.However, the significant drop in engagement rates at both mid-funnel (Registration) and deep-funnel (In-App Purchase) stages should be read as a cause for concern and a trigger to rethink strategies.

Shopping App Users Warm to Buying and Paying with Apps
Japan’s passion for shopping hasn’t quite made its way to mobile yet. While Japan is the number two e-commerce market in APAC, mobile accounts for only 7% of total e-commerce transactions. But this is changing fast as more mobile payment methods and options streamline the process of buying and paying with apps. In fact, mobile commerce sales in Japan (which amounted to $25.9 billion in 2015) are expected to grow to $60.8 billion by 2020. Driving this change is a rising generation of Digital Natives that prefer the convenience of mobile and apps. Another driver is the disruptive expansion of Amazon, a retailer that is altering the local mobile commerce landscape and forcing Japanese brands and retailers to adopt similar models.
Shopping Apps: Cost & Engagement Rates

-
At $37.24, down 3.6% from the previous year ($38.65), you can’t say the cost to acquire a user who continues to make a purchase is a bargain. Nonetheless, the drop is encouraging and signals a sea change in shopping behavior.
-
It’s more good news deeper in the funnel accompanied by an install-to-purchase rate of 9.6%, an increase of 23.1% over the previous year (7.8%).
-
At 32.9%, the install-to-register rate also tells a positive story. Marketers who engage at this stage have what it takes to influence purchases and should tailor campaigns and creatives to stay top of mind.

Utilities Apps See Impressive Engagement
While data about the appeal of Utilities apps in Japan is sketchy, global app market data suggests users universally spend roughly 10% of their mobile app time interacting with utilities apps, 2x the time they spend in most lifestyle apps including health fitness. This has earned them a top-notch spot in our daily app routine and significant real estate on our devices. More than 90% of all smartphone users have installed at least one utility app on their device.
Utility Apps: Cost & Engagement Rates

-
At $12.17, the cost to acquire a user who will complete a registration is moderate.
-
The install-to-register rate of 42.6% is impressive and suggests users understand and appreciate the value proposition offered by apps in this category.
-
Deeper in the funnel, the combination of high cost ($72.95) and low conversion (7.1%) represents a disconnect that marketers should try to bridge with stronger campaigns and a clearer call-to-action.
Mobile Engagement Benchmarks by
Platform
iOS Outperforms and Outspends Android
iOS enjoys a dominant position in Japan, chalking up a 56% market share in Q4 2018 despite a 3.8% decrease in total smartphone shipments. Increasing device costs and high mobile tariffs combine to support the status quo, keeping Android devices in check. However, competition is heating up between Android vendors, a development that could push down handset prices and increase the number of Android users. But this shift will hardly dethrone iOS as the leading operating system and the device preferred by Japan’s biggest spenders. iPhone users spend an incredible $200 per person per year — or more.
Cost & Engagement Rates by Platform
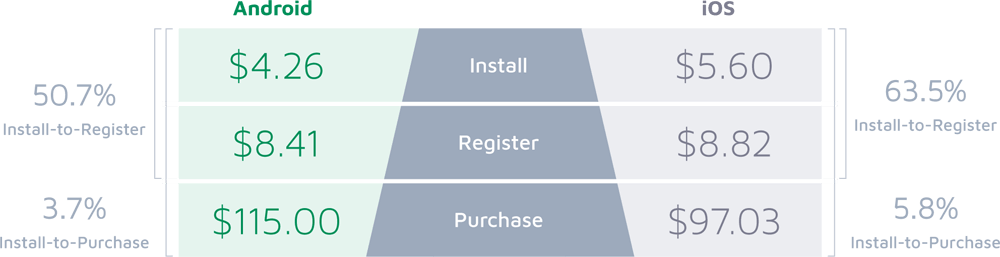
-
At $5.60, the cost to acquire an iOS user is 31.5% more than the $4.26 price tag to acquire an Android user, but conversion rates deeper in the funnel show iOS users offer significant value for money.
-
The 5.8% install-to-purchase rate for iOS users (compared to just 3.7% for Android) suggests campaigns that target iOS users deeper in the funnel are on the money.
-
A comparison with data from the previous year reveals the cost to acquire users who continue on to make a purchase have dropped. Unfortunately, conversion rates have also dipped (down 35% for Android and down 4.9% for iOS).
30-Day
Retention
Rates
Strong Retention Rates Prove High App Loyalty
An examination of costs and conversions indicate Japanese users have a high intent to engage with mobile apps. But do these users also have high retention? A review of data provided by Adjust shows nearly one-third (31%) continue to use the app on Day 1.
Overall 30 Day Retention Rates
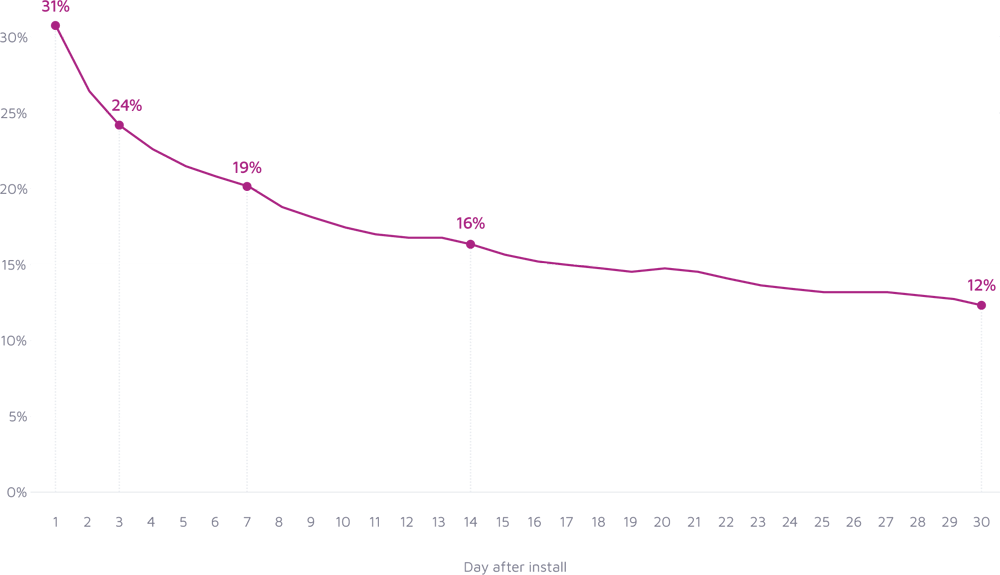
Significantly, it takes a full week for the retention rate to fall under 20%, suggesting that app users are loyal for longer and open to engagement campaigns that spark interest and extend the app lifecycle. At 12%, Day 30 retention is solid and suggests campaigns that resonate with users will reignite interest.
Retention by App Category
Gaming and Shopping Apps Maintain Momentum
A breakdown of retention rates by vertical shows app users download apps with a purpose. Double-digit retention rates for most apps (except Dating) from Day 1 through Day 30 indicate users are dedicated to their favorite apps and convinced of the value they offer. Marketers who make the cut clearly benefit from strong and lasting loyalty.
30 Day Retention Rates by App Category
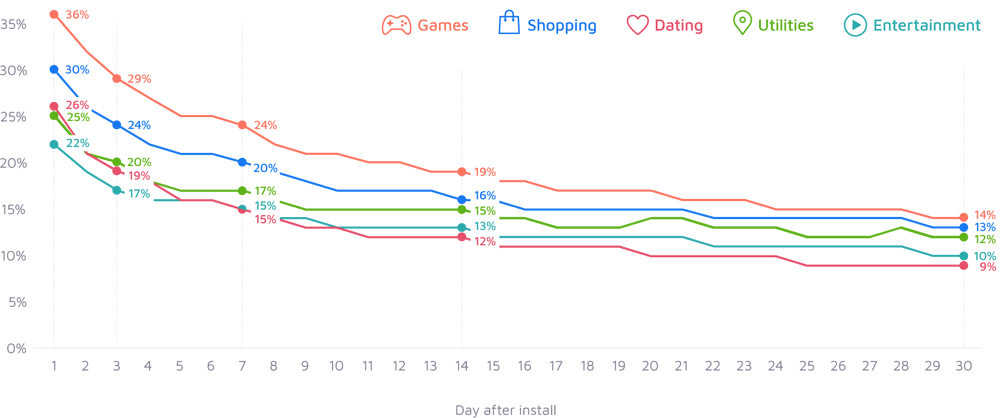
-
With 36% retention on Day 1, Gaming apps lead the pack. The Day 30 retention rate of 14% (the highest of all app categories) indicates users stay with the games they love.
-
Shopping is another sticky app category. The retention curve, which declines in moderate stages of roughly 4.5%, offers ample opportunities when marketers can use relevant messaging to motivate users and possibly prevent churn. A prime example is Day 3 when retention is 24% (and the second-highest rate in this dataset). Also, Day 7 retention hovers at a respectable 20%. At Day 30 retention declines to 13%, again the second highest of all app categories (trailing games by a single percentage point).
-
Utilities and Dating apps get off to a strong start and share a similar retention curve from Day 3 through day 14. This suggests both app categories have staying power. At Day 30, however, the gap widens (Utilities: 12% and Dating: 9%). It’s a sign that Dating apps marketers might benefit from an approach that segments and targets users likely to lapse earlier in the cycle.
-
Retention for Entertainment lags behind the other categories at the beginning, but jumps ahead of Dating by the mid-month mark. Does this indicate that users are fickle after first downloading? The data doesn’t say for sure. However, a comparison with data in the Adjust and Liftoff 2018 Japan Mobile App Engagement Report reveals Day 30 retention for this category has grown 2x in just one year. It’s a signal that appetite for Entertainment apps is healthy — and growing.
Retention by Source
Organic vs Paid: Small Gaps can Make a Big Difference
A breakdown of the retention data by source, comparing users that discovered apps on their own with traffic that was driven with the help of paid promotion, tells two interesting stories.
30 Day Retention Rates by Source
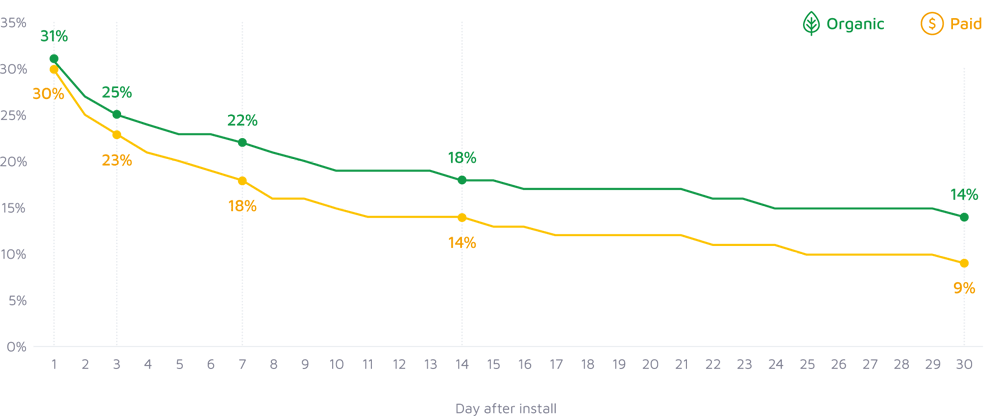
-
Japanese users are loyal to the apps they choose— especially if they discover their favorite apps organically. This is what you would expect in a market where social networks, influencers, and celebrities play a major role in how users discover apps and games.
-
However, the fact that there are only a few percentages between paid and organic at the most critical stages (Day 1, Day 3 and Day 7) indicates that paid promotion is an effective way to reach and recruit users for your app. But alone, paid isn’t enough. The relatively low Day 30 retention of 9% (compared with 14% for organic) suggests marketers who choose paid must also prioritize re-engagement efforts and relevant messaging to stay top of mind with their audience.
Mobile
App Session
Analysis
Gaming and Entertainment Apps Lead in Session Time
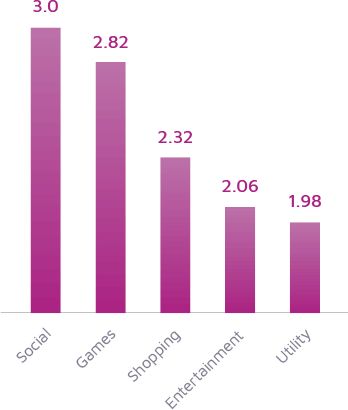
Unsurprisingly, Japan — the home of Sony, Nintendo and Konami — stands out as a hotbed of gaming activity. A breakdown of app session data over 30 days shows Gaming (with 2.82 sessions per day measuring a whopping 23.18 minutes) dominates time spent in apps.
Average Session
Per User Per Day Over 30 Days
Average Session Length
Per User Per Day Over 30 Days
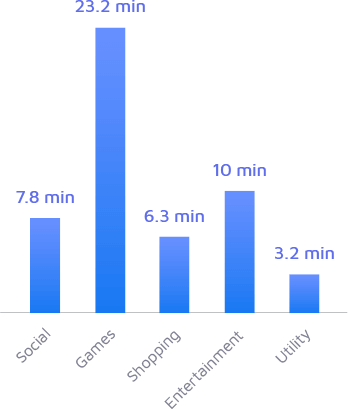
With three sessions per day, Social is the app category users turn to more frequently than any other. However, the session length of 7.76 minutes suggests users are dipping in and out, not exploring for long periods of time.
It’s a similar situation with Shopping apps, the category that comes in third place with 2.32 sessions per day. However, the session length of 6.25 minutes suggests users are reaching to apps early (and frequently) in the funnel to research purchases. The outcome is a multitude of micro-sessions when relevant offers and advertising that reinforce brand value could clinch a sale.
Entertainment apps are the paradox of the dataset. While the number of sessions (2.06) is at the low-end of the spectrum, the session length of 9.96 minutes is impressive. Do the math, and it’s a category with audience appeal and growth potential.
With 1.98 sessions per day, Utility apps place last in the list. But the average session length of 3.2 minutes shows users have made these apps a habit. Marketers would do well to explore approaches that monetize audience attention and time spent in essential tools such as emoji keyboard apps, an app-subcategory that is staggeringly popular in Japan.
Seasonal
Trends
Summer Months Offer Attractive CPIs
Seasonality is a factor that continues to impact acquisition costs and cost-per-action in Japan. However, a closer examination of the data reveals important windows of opportunity when app marketers can drive positive results without draining budget.
Cost-Per-Install by Month

-
At a high level, it’s interesting to note the monthly CPI trend is nearly identical to the pattern observed in last year’s Japan Mobile App Engagement Report. Predictably, the peak season is around the holidays (including Christmas, which has become a commercial hit in Japan). At $6.04, the CPI in December is the highest (up 1.17% from $5.97 the previous year).
-
Significantly, CPIs in October ($4.37, down 15.3% from $5.16 the previous year) and November $5.21, down 5.6% from $5.52 the previous year) are attractive months for user acquisition campaigns.
It’s the period before holidays that push CPIs to their highest point, and aligned with Shichi-go-san (November 15), the festival when parents and grandparents splash out cash for gifts for children ages 3, 5 and 7.
-
CPIs in June ($5.14, down 4.6% from $5.39 the previous year) and July ($5.30, down 14% from $6.16 the previous year) offer marketers value for money.
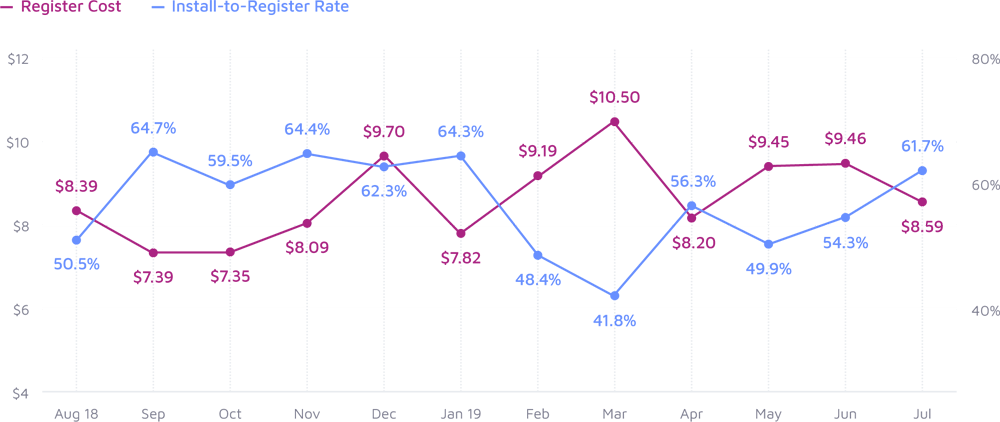
Registration Costs & Engagement Rates by Month:
Prices Drop and Engagement Soars
-
The good news: App marketers can buy low and engage high at this important mid-funnel stage.
-
A review of data the period August through July shows the cost to acquire a user who completes a registration has dropped an average of 22.6% compared to the previous year. The install-to-register rates for the same period have increased an average of 11%.
-
September through January are the months to target for the best results. Interestingly, this is a radical shift from the previous year when these months were marked by significantly higher costs and lower conversion rates
-
Be prepared to work hard to acquire and engage users in the postholiday period. February (when costs at $9.19 are at the high-end and engagement acceptable at 48.4%) and March (when costs hit the highest point at $10.50 and engagement is at an all-time low of 41.8%) are months to avoid unless your campaign has what it takes to be highly targeted, valuable and relevant.
Register Costs & Install-to-Register Rates by Month
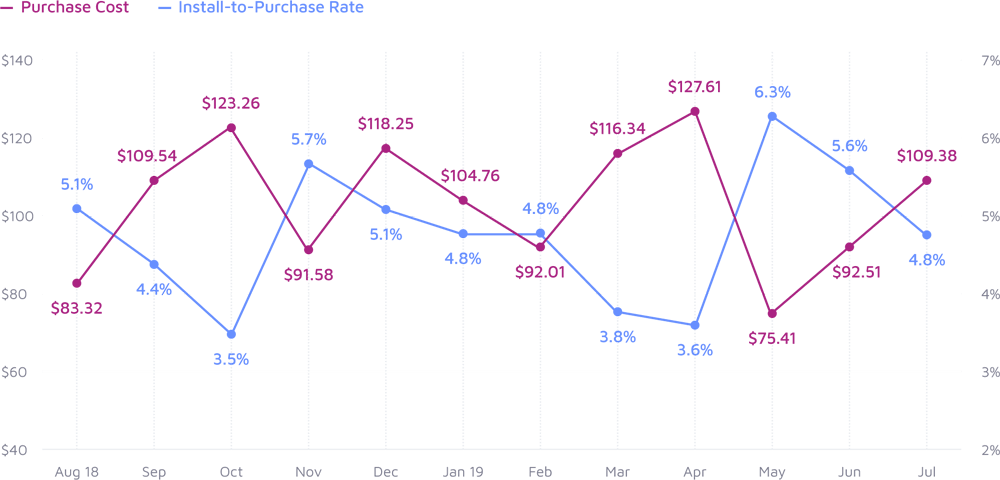
Purchase Costs & Engagement Rates by Month:
Users are Primed for Purchases in Early Summer Months
-
Once again, a comparison of data year-on-year highlights a positive trend for marketers who seek to acquire and engage users.
-
At $103.66 (on average), the cost to acquire a user who completes a purchase may be pricey — but it’s important to note this cost is an impressive 25.8% less than last year’s price tag of $139.62.
-
Likewise, the install-to-purchase rate (an average of 4.8% up from 3.6% the previous year) strongly suggests Japanese users are reaching to their apps to buy, not just browse.
-
May, June and July stand out as stellar months when marketers can acquire highly engaged users at a reasonable cost. This is also a period when users, many of whom have received their bonuses, are either spending on trips and fun ways to spend the summer, or focused on making more meaningful purchases in order to properly observe Obon, the spiritual festival honoring ancestors that is one of the biggest events in the calendar year
-
March (cost: $116.34, conversion: 3.8%), April (cost: $127.61, conversion: 3.6%) stand out as months when costs are high and engagement rates are disappointing. September and October are also months that will test a marketer’s mettle.
Purchase Costs & Install-to-Purchase Rates by Month
![]()
Adjust is the industry leader in mobile measurement, fraud prevention and cybersecurity. Born at the heart of the mobile economy and grown out of a passion for technology, the globally operating company now has 15 offices around the world.
By making marketing simpler, smarter and more secure, Adjust empowers data-driven marketers to build the most successful apps in the world. Adjust is a marketing partner with all major platforms, and in total, more than 28,000 apps have implemented Adjust’s solutions to secure their budgets and improve performance.
Adjust recently acquired companies Acquired.io and Unbotify, and in June 2019, secured one of this year’s largest funding rounds in Europe to date, raising $227 million.

Liftoff is a performance-based mobile app marketing and retargeting platform which uses post-install user data to run true cost-per-action user acquisition and re-engagement campaigns. Powered by advanced machine learning and lookalike targeting, Liftoff campaigns are optimized to drive actions beyond the install, like booking a hotel, making a reservation, or renewing a subscription. Liftoff’s cost-per-action model helps customers scale and grow by acquiring users that actively spend in revenue-producing events. Headquartered in Palo Alto, CA with offices in New York, London, Singapore, Tokyo, and Paris, Liftoff works with leading app publishers and brands across the globe.