Will 2020 Be the Year of Android Gaming?
Liftoff’s 2019 Gaming Apps Report includes key findings on the latest user acquisition trends and benchmarks to guide gaming apps marketers. The report analyzed over 107 billion ad impressions, nearly 82 million installs, and 14 million first in-app purchases from 555 gaming apps between June 2018 and May 2019. Noticeably, games played on Apple devices saw a steep decline in engagement compared to Android, which indicates that trade-offs should be made when investing.
This report is offered in English, Japanese and Chinese.
High Funnel Conversion Rates
In last year’s annual Gaming Report, iOS users came at a higher price to acquire and make in-app-purchases while also offering app marketers good value for their money. In 2019, the data suggests that the platform is losing steam and Android is a valuable contender.
iOS has traditionally been the platform for gaming and overall higher revenue generator year after year compared to Android. However, Android has a huge market reach, and the users are a bargain to acquire. It costs $3.21 to acquire an Android user, compared to $4.85 for iOS.
Android Closes the Gap
The cost to acquire an Android user ($33.83) who makes an in-app-purchase has increased by 9.9% from last year, not far from the cost to acquire an iOS user ($36.63).
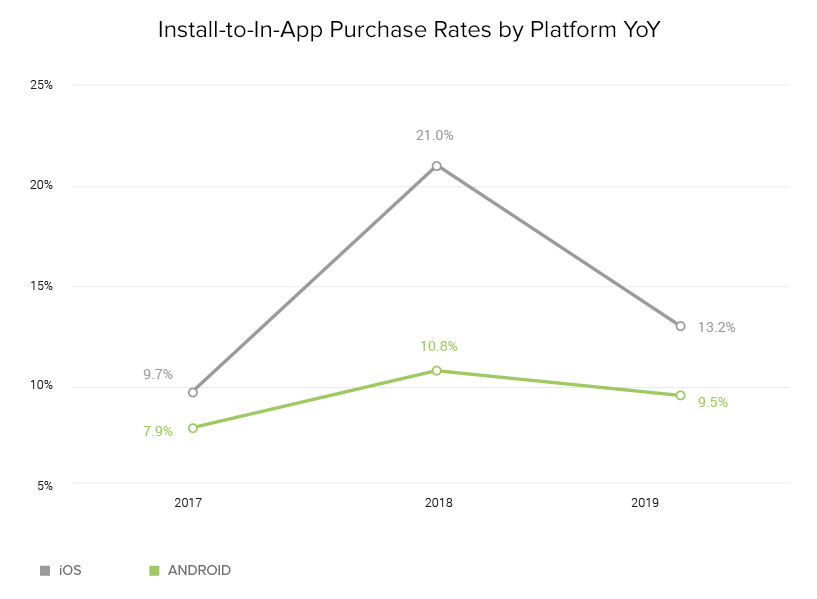
When analyzing year-on-year engagement trends, we see a pivotal shift with in-app-purchase rates. A steep decline occurs in rates for iOS users, (37.1% decrease from 2018), which may be the start of a downward trend that will overturn strategies that focus exclusively on winning big-spender iOS users. If this trend continues, marketers may be keen to invest more on Android users.
For deeper insights and 2019 mobile gaming app benchmarks, download the full report or watch our on-demand webinar Marketing Mobile Games: Insider Stories on Scaling Growth.