Table of Contents
Introduction
With a population of 650 million people (nearly double that of North America), Southeast Asia is home to the world’s most engaged mobile users.
According to the latest report from Google & Temasek, 90% of Southeast Asians connect to the internet primarily through their smartphones and spend four hours in mobile apps every day. On average, that’s an hour more than elsewhere in the world.
Mobile is at the heart of economic transformation in the region. BCG cites rising affluence, urbanization, and growing demand for convenience as the key drivers of consumer behavior in Southeast Asia. Local mobile-first “unicorns” like Grab (valued at $3bn), Garena ($3.75bn), and Go-Jek ($3.75bn) have successfully tapped into these trends, bringing even more money into mobile as investors bet big on the region’s rapid growth.
The challenge? A one-size-fits-all-region approach to scaling mobile growth doesn’t work in Southeast Asia (SEA). The region is known for its cultural, political, ethnic, religious, and linguistic diversity — not to mention starkly contrasting income levels. Despite the widespread adoption of digital tech and growth of income, much of the Southeast Asian region still punches below its weight when it comes to purchasing power parity. To succeed, mobile marketers will need to take a hyper-local approach in each country in SEA, and rely on data to guide their strategies.
The good news is the data shows that acquiring mobile users in Southeast Asia comes at a bargain price compared to the more mature markets. At the same time, understanding regional nuances and the impact of seasonality can help marketers navigate the challenges of achieving stellar performance deeper in the funnel, acquiring engaged, loyal, and revenue-generating mobile users. The Liftoff 2019 Southeast Asia Apps Engagement Report benchmarks critical engagement metrics throughout the app funnel, from install to important post-install events, to help you scale your mobile acquisition campaigns in the region.
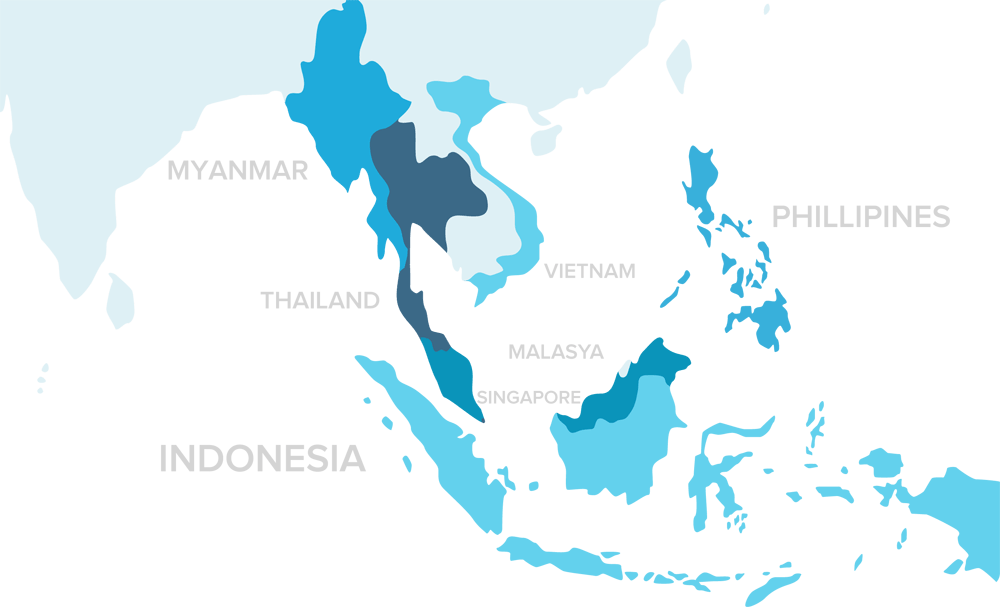
The report provides marketing insights from Liftoff mobile app campaigns in Malaysia, Indonesia, Philippines, Vietnam, Myanmar, Singapore and Thailand from March 1, 2018 through February 28, 2019, spanning 28 billion ad impressions, 656 million ad clicks, 5.2 million installs, and 13.5 million first-time post-install events.
In addition to benchmarking the average cost per install for apps in Southeast Asia, the report drills into campaign performance at a deeper level to understand costs and engagement rates for registrations, subscriptions, and purchases in the region. The data is also broken down by platform (iOS and Android) with a deeper dive into Shopping and Gaming, two of the most popular app categories. Thanks to our partner Adjust, the report also includes retention data by country and app category to help you better analyze post-install behavior in the region.
We hope the data and insights shared in this report will help you develop (and benchmark) winning strategies to grow your mobile business in Southeast Asia.
Mobile Engagement Benchmarks
Across the board, acquiring users in Southeast Asia comes at a bargain price compared to other APAC countries as well as the United States.
The trend is a reflection of deeper market development and heightened competition in the regions where mobile has reached maturity. According to a recent App Annie report, 2018 app downloads in Indonesia, for example, were up by 55% compared to just 5% in the U.S., signaling faster consumer adoption of mobile apps.
Overall App Costs and Conversion Rates in SEA
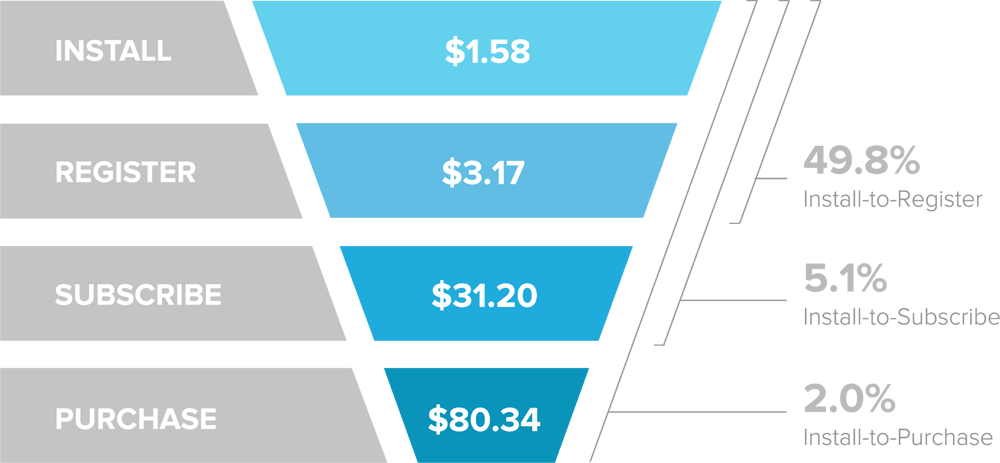
Top of funnel, installs in Southeast Asia cost 73% less than in the U.S. ($1.58 vs. $5.88)1. Deeper in the funnel, first-time events on average cost 50% less in Southeast Asia compared to the U.S. ($3.17 vs. $8.64 for registrations, $31.20 vs. $92.34 for subscriptions, and $80.34 vs. $132.58 for purchases.)
1 Liftoff data from March 1, 2018 and though February 28, 2019
Costs by Region
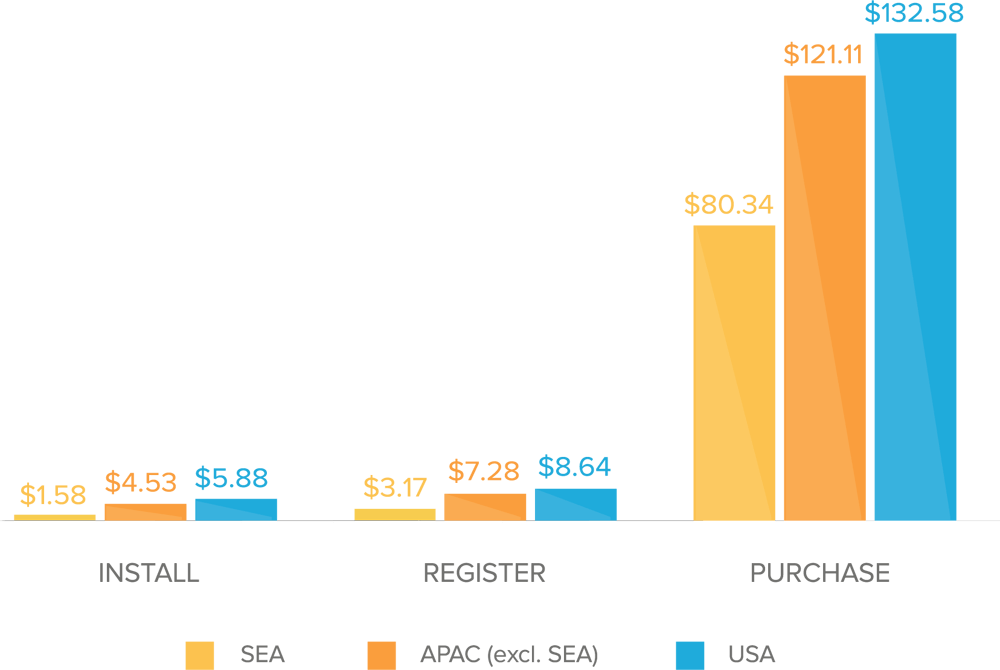
That’s not surprising given how many mobile ads compete for user attention in the U.S., the world’s largest economy. But even if you look at the neighboring APAC countries, mobile users in Southeast Asia still cost less to acquire, though the difference is less pronounced. Compared to other countries in APAC, installs in Southeast Asia cost 65% less ($4.53 vs. $1.58) and registrations 56% less ($7.28 vs. $3.17). Even coming at a steep price of $80.34, the cost of acquiring users who make a first purchase in Southeast Asia is a steal compared to prices in the rest of APAC ($121.11).
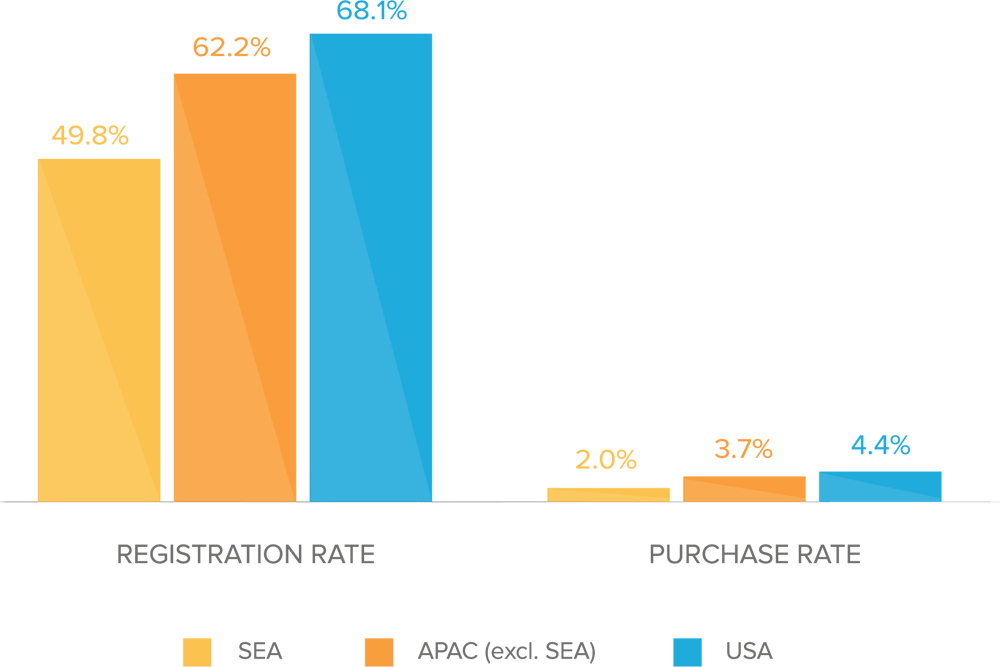
But even though installs cost less in Southeast Asia, engagement rates are much lower compared to the rest of APAC and the U.S., where mobile users register and purchase at a much higher rate. The challenge for mobile marketers is twofold. First, the region is less affluent compared to more mature markets. Second, scaling campaigns is more difficult in SEA because the region is very diverse. Improving ad relevance by customizing content for different audience segments is the next frontier for marketers looking to capitalize on growth opportunities in Southeast Asia.
Conversions by Region
Seasonal Trends
Seasonality influences mobile user acquisition costs and engagement rates in all markets.
Certain categories, such as shopping and fitness, experience the same trends every year: increased holiday spending before Christmas, back-to-school shopping frenzy around September, and a boost in workout app subscriptions in January. But in Southeast Asia, seasonal campaign planning is more complex because the region is so diverse.
Outside of holidays celebrated globally, an important consideration for marketers in Southeast Asia is the Islamic holy month of Ramadan when people forgo food and drink from dawn until dusk. Its real impact on business is often unpredictable because the holiday is not pegged to the same time each year. For context, the data in this report covers 2018. (In 2018, Ramadan began on May 15th and ended in the evening of June 14th.)
Consumer patterns in Southeast Asia are also influenced by other factors: tourist seasons, regional New Year celebrations (like Songkran in Thailand), shopping holidays in neighboring China (Singles’ Day), and obviously, weather. From Singapore to Vietnam’s Ho Chi Minh City, marketers need to employ a hyper-local approach to acquire and engage high-value mobile users at the right time.
Monthly Costs per Install
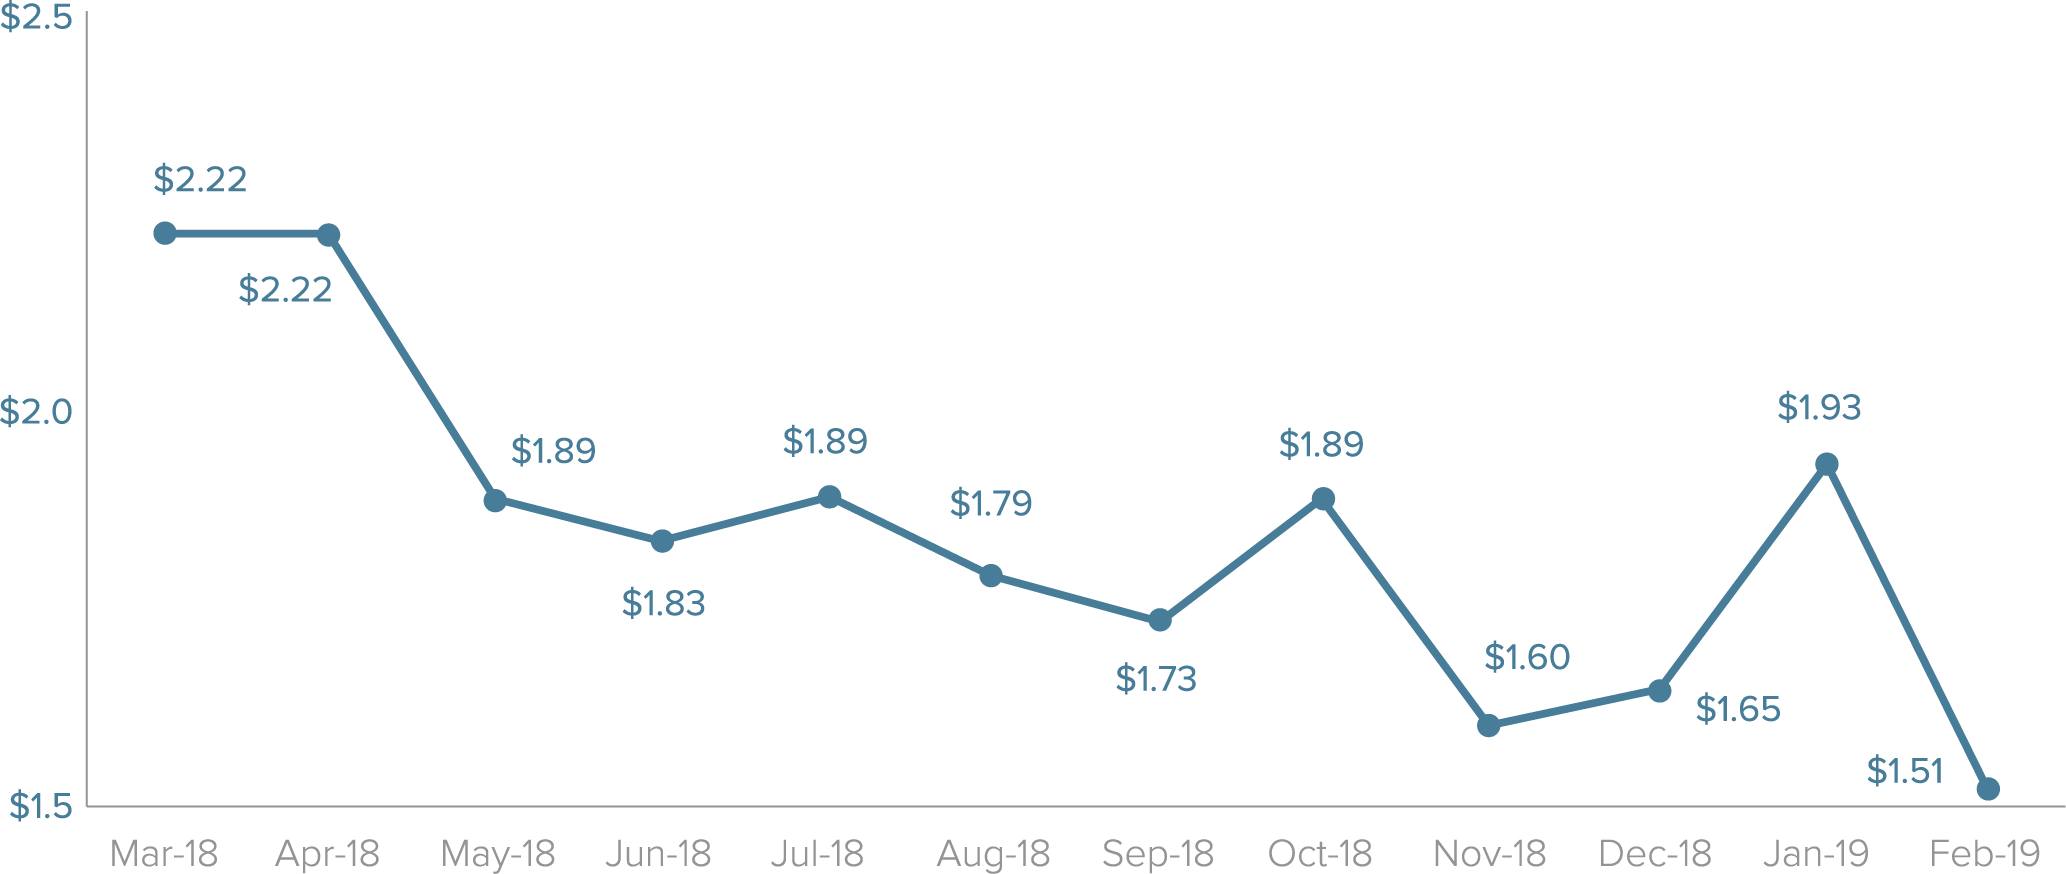
In a region where people spend an average of four hours on their smartphones daily, marketers have the opportunity to reach and engage their audiences at any time throughout the year. However, the data shows significant variance in monthly install costs.
Low CPIs in November, December and February suggest a strong interest in apps — and fewer advertisers competing for user attention on mobile. In March and April, on the other hand, CPIs reach $2.22, signaling that marketers will need to spend more money to capture consumer demand in spring.
Average Monthly Cost per Install
Southeast Asia is very diverse. Being hyperlocal in targeting and understanding the local nuances for each country is key to achieving great performance.
– Ryan Pham, Sr. Regional Performance Marketing Manager at Grab
Registration: Monthly Costs & Conversion Rates
Install costs only capture a small part of the performance picture. The best time to invest in user acquisition is when post-install conversion rates are at their highest while costs (CPIs and CPAs) are at their lowest. Registration rates, for example, show the percentage of users who sign up for an account after they install in app — a strong predictor of higher engagement deeper in the funnel.
Registration: Monthly Costs & Engagement Rates
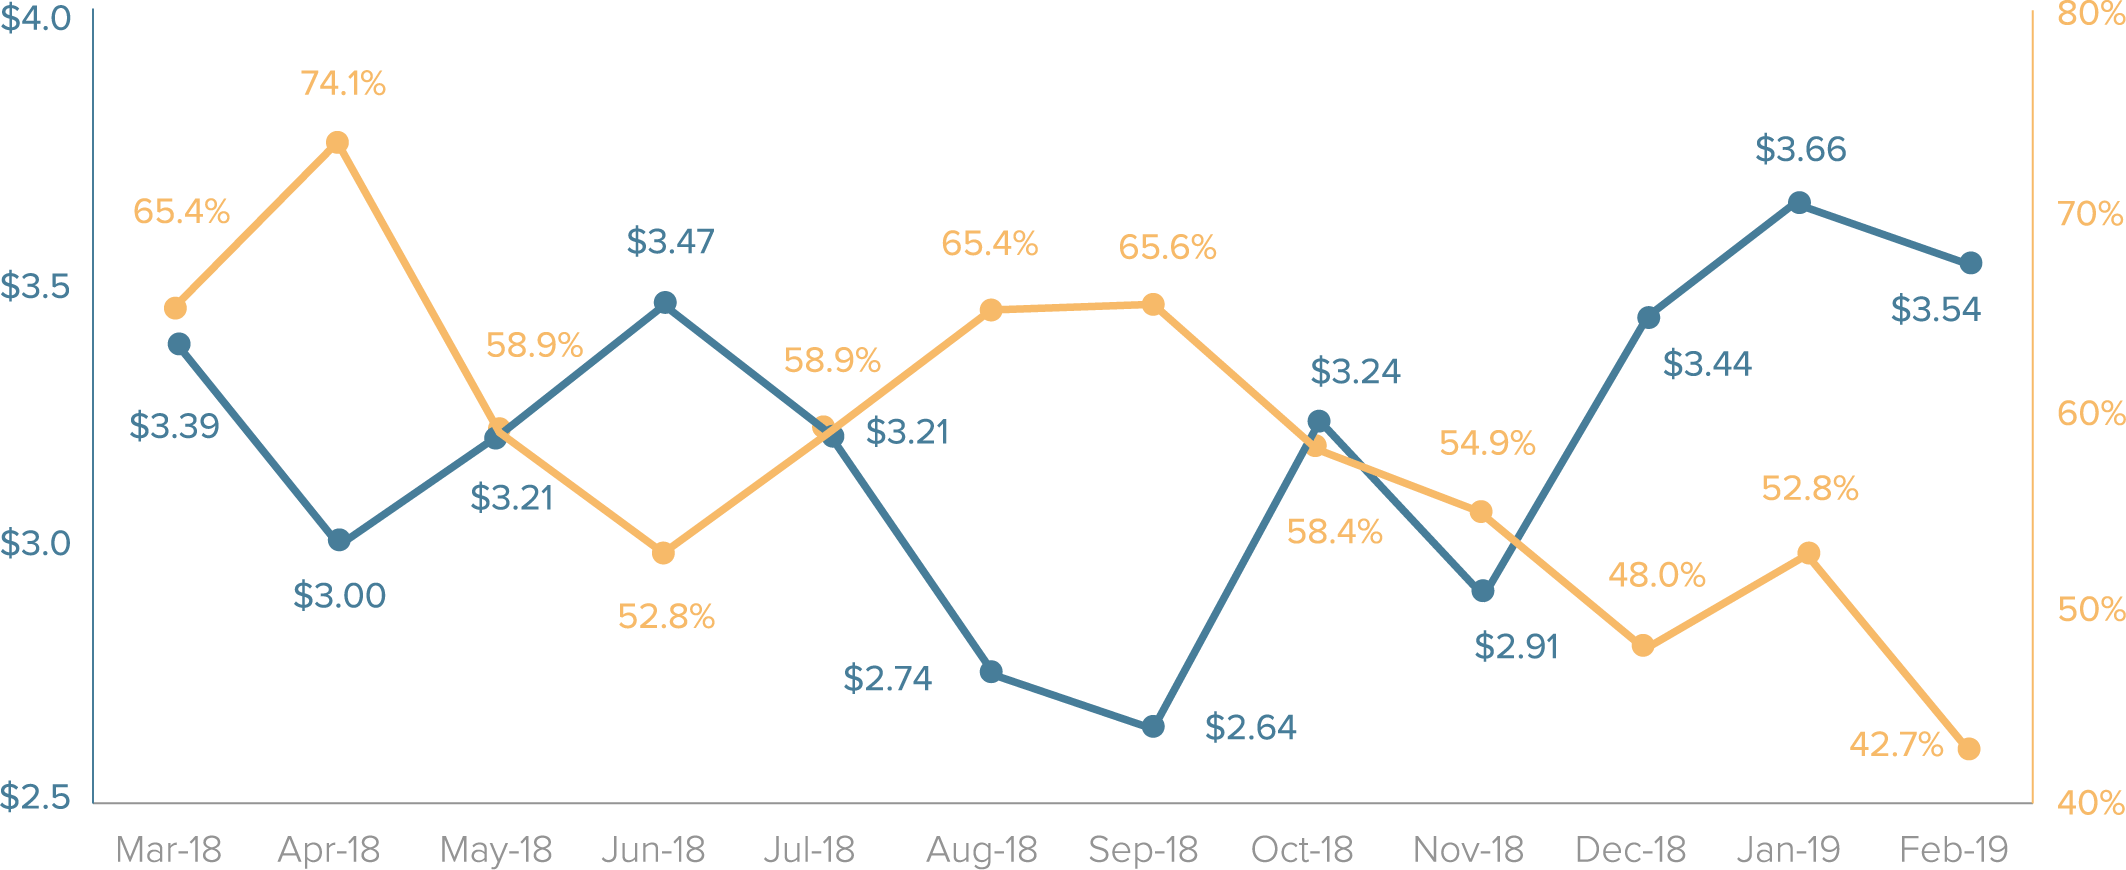
In SEA, the cost per registration is lowest in August ($2.74) and September ($2.64). With registration rates over 65%, these months are perhaps the best times to grab user attention and encourage mid-funnel interactions. April is another great time when the engagement rate reaches the annual high of 74% while costs are below the average for the year — perfect for Songkran (the Thai New Year’s national holiday) campaigns.
In the winter months, registration rates cool down significantly while the acquisition costs increase. This dynamic suggests that marketing around Christmas and New Year holidays in Southeast Asia can be an uphill battle.
Purchase: Monthly Costs & Conversion Rates
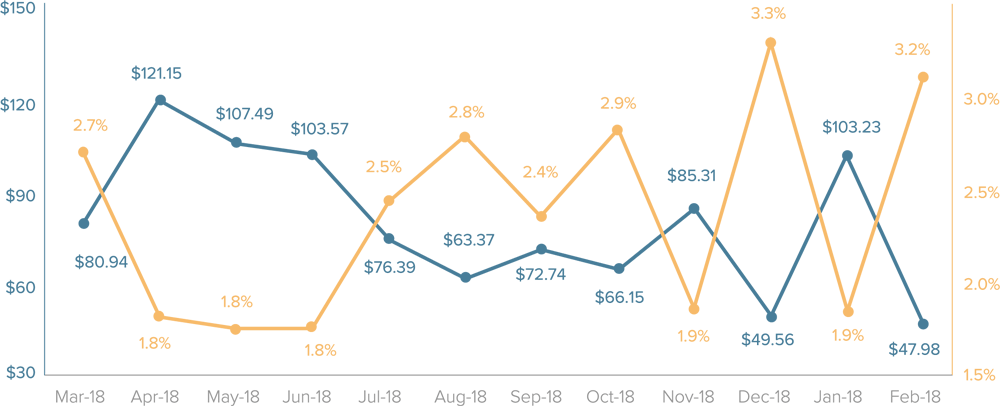
February is a fantastic season in certain parts of Southeast Asia (especially Thailand), with balmy weather and little rain. While travel prices during the high season predictably soar for visitors fleeing cold winter in their home countries, costs for acquiring mobile users who make a purchase actually decrease. With costs per purchase at $47.98, February is the best month to acquire engaged users. As the weather heats up during the shoulder season in the region (from April through June), the price tag for a mobile user also increases while purchase rates drop.
Purchase: Monthly Costs & Engagement Rates
Engagement by Platform
Android is the dominant computing system on a global scale. Across all regions, Android users cost less than iOS users, but iOS users are usually known as the “Big Spenders,” offering better value for the money.
In SEA, where Android’s dominance is more pronounced than in other parts of the world, Android users not only cost less but also purchase at a higher rate than iOS users (2.19% on Android vs. 1.81% on iOS).
This dynamic is prominent in all APAC countries except for Japan (with a purchase rate of 4.03% on Android vs. 5.12% on iOS), where iOS users are more engaged. Granted, iOS takes up over 70% of the mobile OS market share in Japan, compared to 40% in Singapore and just 5% in Indonesia.
Platform: Costs & Engagement Rates
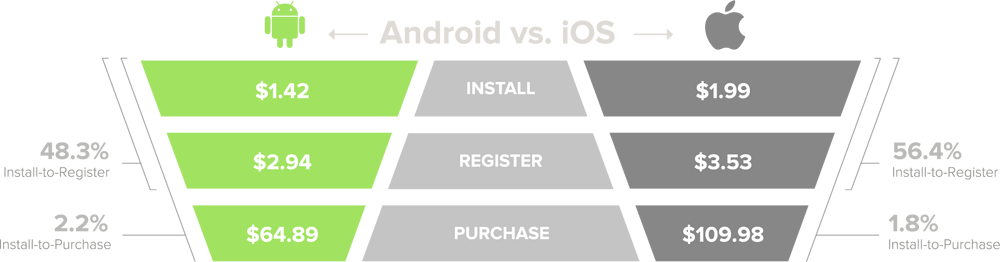
Android users not only cost less but also purchase at a higher rate than iOS users (2.19% on Android vs. 1.81% on iOS)
Engagement by App Category: Gaming and Shopping
Powered by a large and highly engaged user base, the mobile economy in Southeast Asia encompasses apps of all types.
But according to Google & Temasek, the following four areas drive the most growth: ride hailing, online media (including mobile gaming), online travel, and online shopping. To ensure a large diversity of apps represented in our research sample, this report focuses on two specific app categories, gaming and shopping.
Gaming Apps
With 164M gamers in 2018, up from 130M just three years prior, Southeast Asia is one of the world’s fastest-growing gaming markets. Thanks to close proximity to China, mobile users in Southeast Asia have access to cheap devices with large screens and long battery lives. Mobile data is cheap too: 1GB costs less than 1% of monthly income, so people rarely worry about the new titles gobbling up their mobile Internet budget. And compared to China, where all games need a license to be published, regulations in Southeast Asia are more relaxed, which continues to drive supply of cheap, on-the-go entertainment.
While there’s no doubt about the size of the market, the important question is, are mobile users in Southeast Asia ready to pay to play? Our data shows that while the price tag for mobile app installs and registrations may be low, deeper-funnel actions, such as in-app purchases, cost a premium.
With 164M gamers in 2018, up from 130M just three years prior, Southeast Asia is one of the world’s fastest-growing gaming markets.
Gaming Apps: Mobile Engagement Benchmarks
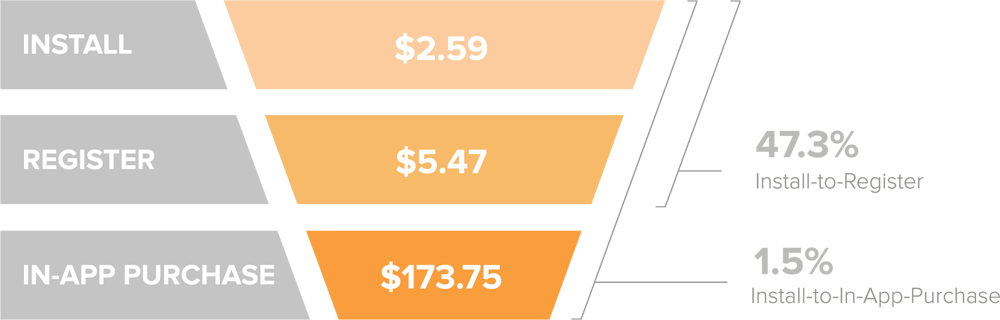
Compared to the rest of the world, top and mid-funnel user acquisition costs for gaming apps are nearly 30% lower in Southeast Asia. Deeper in the funnel though, the dynamic changes dramatically. Acquiring users who make an in-app purchase costs $173.75 per user.
Granted, this high number only reflects first-time events and doesn’t include repeated in-app purchases. Engaged players usually make several in-app purchases over time (add-ons, power-ups, extra lives, currency, etc.), so the ROI on a loyal and high-LTV mobile gamer can be huge. According to Slice Intelligence (via Rakuten), in some hardcore mobile games, players spend on average $550 on in-app purchases.
Gaming Apps: Costs & Engagement Rates
Gaming Apps: Monthly Costs & Conversion Rates
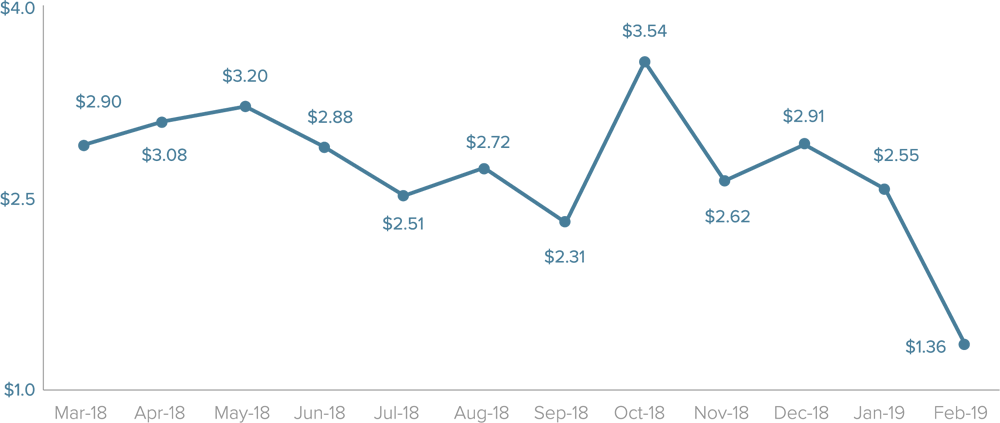
Monthly Costs Per Install
Install costs plummet in February, making it the best month for acquiring app installs at a low price ($1.36). The competition for mobile gamers is the toughest in October when CPIs increase to $3.54, the year’s high.
Gaming Apps: Average Monthly Cost per Install
Registration: Monthly Costs & Conversion Rates
In October, install prices increase, but it’s also when the install-to-registration rate is the highest — a reminder to look beyond top-funnel metrics when evaluating campaign performance. With a 64.9% registration rate and $5.45 CPA, October is one of the best months to acquire users who register.
Gaming Apps: Registration Costs & Engagement Rates
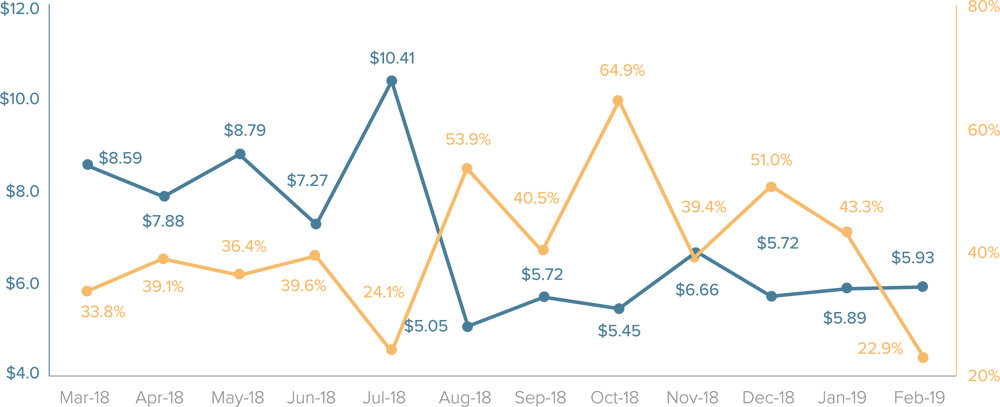
In general, from October through January, registration rates are high. In spring and summer, on the other hand, registration rates drop and costs go up, indicating that mobile gamers become less receptive to ads.
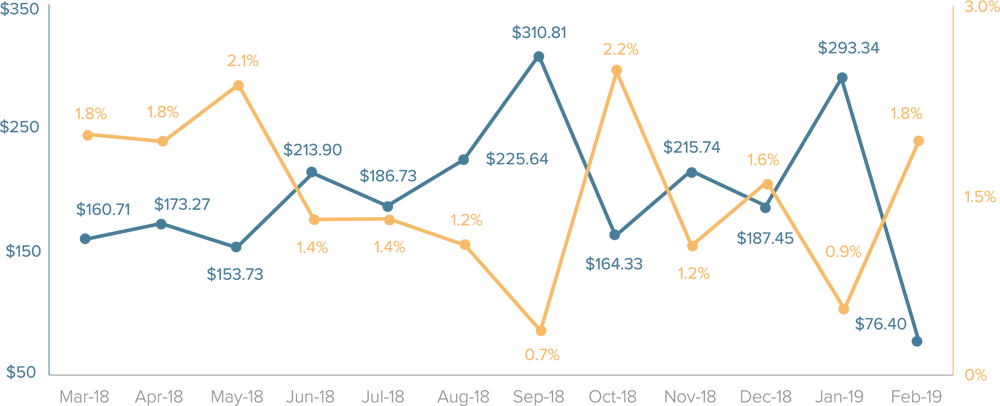
In-App Purchase: Monthly Costs & Conversion Rates
Throughout the year, mobile users who engage in deeper-funnel actions come at a steep cost. In February, however, the cost per user who makes an in-app purchase drops to $76.40 — half of the average price.
Gaming Apps: In-App-Purchase Costs & Engagement Rates
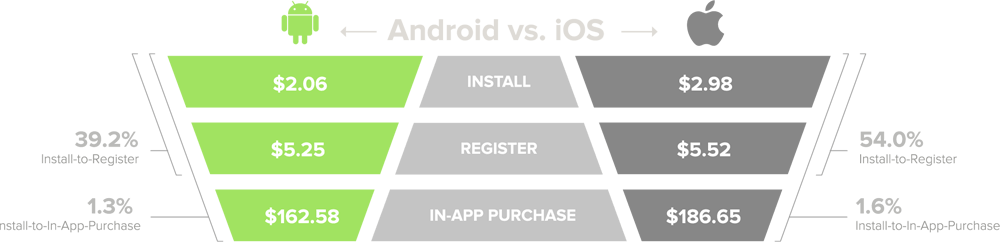
Gaming Apps: Engagement by Platform
An examination of the data by platform predictably reveals lower costs for Android users across all stages of the funnel, from install to in-app purchase. This mirrors the dynamic that we observed across the aggregate of all app categories in Southeast Asia.
Overall, long-term revenue opportunities for gaming app publishers in Southeast Asia are clearly attractive. The number of gamers in the region is projected to grow from 244 million in 2018 to 309 million in 2022. Low costs for installs and registrations prove the strong interest in gaming apps among mobile users in SEA. However, high costs deeper in the funnel coupled with lower purchase rates compared to other regions show that mobile marketers still have a long way to go to unlock the market’s potential.
Gaming Apps: Costs & Engagement Rates by Platform
Shopping Apps
Adweek named 2018 the year of e-commerce in Southeast Asia. But for a mobilefirst region with a very young population, Southeast Asia has a shockingly low percentage of total retail sales coming from online shopping. Just 1% — although this number is projected to grow to 6.4% by 2025, according to Google & Temasek.
Granted, growing online revenues in the region is not entirely a user acquisition problem. Logistics, infrastructure, and low digital wallet adoption rates remain a hurdle. In Vietnam, for example, Hanoi and Ho Chi Minh, its biggest cities, lie almost a thousand miles apart, posing a challenge for delivery, especially considering poor roads and growing traffic congestion in the region. At the same time, the State Bank of Vietnam has tight rules for e-wallets — another innovation that is a prerequisite for e-commerce growth. About 46% of the country’s population primarily use cash to transact.
But that is changing, in Vietnam and the broader region. In 2016, the government of Vietnam approved a comprehensive four-year plan and set targets for developing e-commerce. And in Thailand, the government is working to improve digital payments, having launched PromptPay in 2017 as part of the Bank of Thailand’s e-payment initiative to move the country to digital money.
So despite a few challenges clouding the outlook, e-commerce in the region is expected to grow and exceed $100bn by 2025, according to Google & Temasek. Southeast Asian customers are young, tech-savvy, and price-sensitive. Many of them already shop on Lazada, Shopee, and Tokopedia — the region’s biggest online shopping platforms. And looking at this year’s shopping app data in SEA, the costs for acquiring engaged mobile shoppers are lower than anywhere else in the world.
Shopping Apps: Mobile Engagement Benchmarks
Compared to global benchmarks, acquiring users who install, register, and purchase in Southeast Asia comes at a low price.2 At 40%, registration rates in Southeast Asia are impressive, a dynamic that shows a much higher level of engagement compared to the global rate of 17.5%.
Shopping Apps: Costs & Engagement Rates
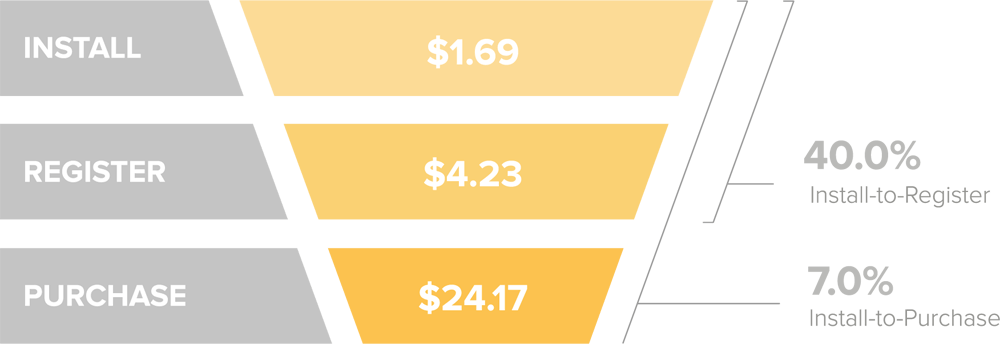
Purchase rates in the region mirror last year’s 7% global benchmark, signaling that Southeast Asia is about as ready to spend money on mobile as any other region in the world.
2 Installs cost nearly 60% less than the global benchmark ($4.11). Users who register cost $4.23, an 80% decrease from the global benchmark of $23.47. Users who make a purchase cost 58% less compared to the global average ($58.35). Source: Liftoff 2018 Mobile Shopping Apps Report.
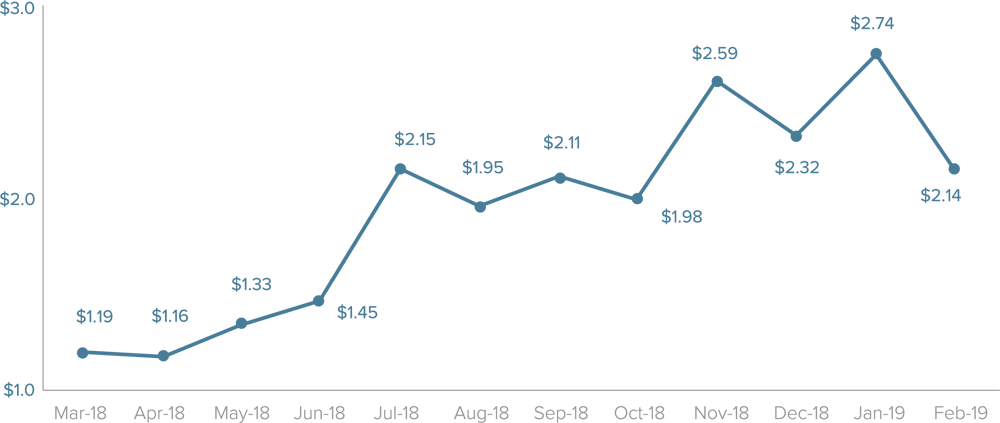
Shopping Apps: Monthly Costs & Conversion Rates
Seasonal variance in the cost per install for shopping apps in Southeast Asia is similar to global trends, particularly at the end of the year when mobile advertising costs peak during the holiday season. But compared to the rest of the world, Southeast Asia — the land of contrasts — has the widest range between the minimum and maximum install costs.
From March to June, installs cost the least, hitting a low of $1.16 in April. Costs spike in July and hover, on average, around $2 per install for the remainder of the year, reaching $2.74, the year’s high, in January.
Monthly Costs Per Install
Shopping Apps: Average Monthly Cost per Install
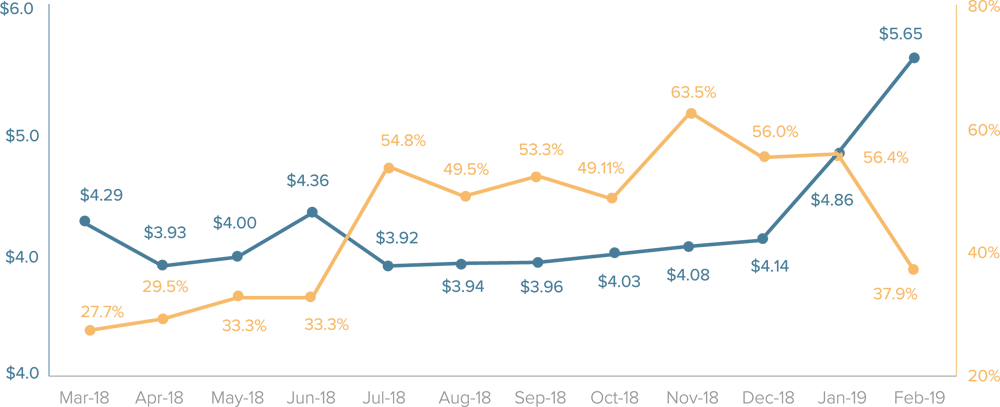
Registration: Monthly Costs & Conversion Rates
Registration costs and conversions offer the best of both worlds from July through November, signaling the right time to acquire mobile shoppers. Starting January and through June, prices go up while registration rates drop below 30%.
Shopping Apps: Registration Costs & Engagement Rates
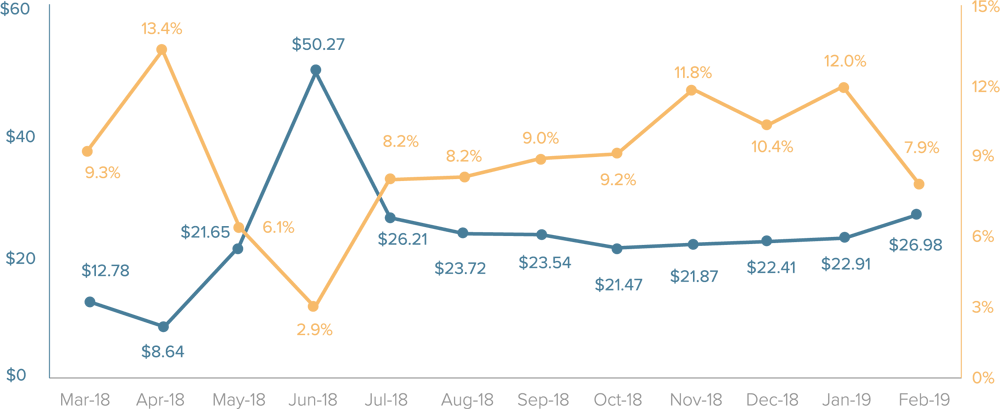
Purchase: Monthly Costs and Conversion Rates
With a low $8.64 cost per purchase and a high 13.4% purchase rate, April offers the biggest window of opportunity for app marketers to acquire mobile shoppers who are ready to act quickly. In contrast, June (coinciding with the holy month of Ramadan in 2018) has high costs and low purchase rates.
Shopping Apps: Purchase Costs & Engagement Rates
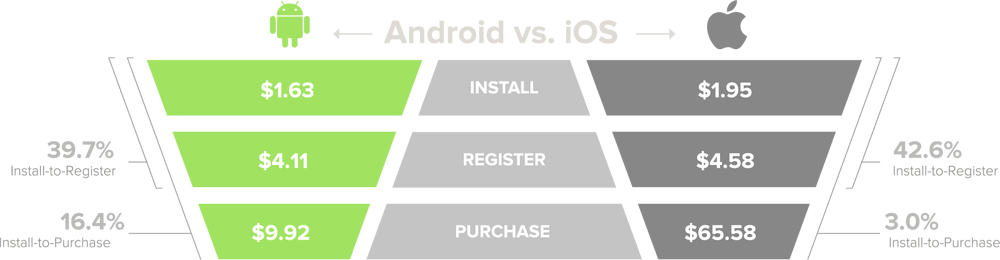
Contrary to the common perception that iOS users are the “Big Spenders” of the ecosystem who offer better value for the money, our shopping app data in SEA suggests quite the opposite.
Shopping Apps: Engagement by Platform
Contrary to the common perception that iOS users are the “Big Spenders” of the ecosystem who offer better value for the money, our shopping app data in SEA suggests quite the opposite. Android users in Southeast Asia cost less than iOS users top and mid-funnel, and significantly less than iOS users at the bottom of the funnel. At the same time, they also register and purchase at a higher rate compared to their iOS counterparts.
Android remains the dominant OS on a global scale yet historically lags behind iOS in terms of engagement. Southeast Asia might be a global “exception”: in SEA, Android users are not only the majority but also the most engaged market segment.
Shopping Apps: Costs & Engagement Rates by Platform
Mobile Retention
As the mobile app economy matures, mobile marketers shift their focus towards re-engagement and retention.
After all, acquiring new users is more expensive than retaining existing ones. In Southeast Asia, the average daily retention for different app categories varies widely by country — a reflection of the region’s diversity in consumer wants and needs.
Overall, Singapore has the highest mobile retention rate in SEA. This is partially due to the fact that many Singaporeans are heavy social media users. In Singapore, 83% of the total population are active on social media, compared to 42% on average in SEA. In Southeast Asia, Social Networking is the stickiest app category based on the average day 30 retention rate.
These insights are based on combined organic and paid data from Adjust, a mobile measurement company, covering the period from January through December 2018 and organized into a cohorted 30-day view. Adjust data examines the average daily retention, defined as the percentage of users who come back to use the app on a specific day.
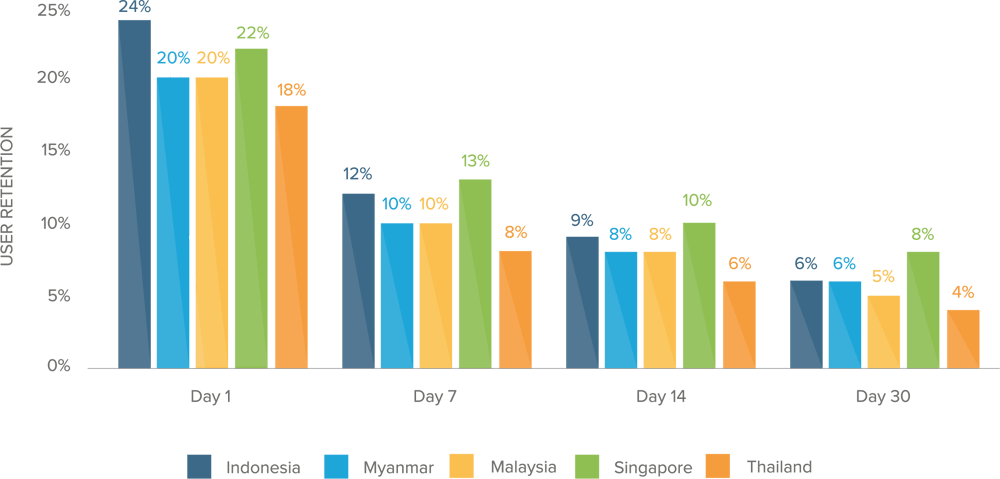
Retention Rate by Country
Mobile users in Indonesia show the highest Day 1 retention rate at 24%, but that changes quickly. On day 7, only 12% of users come back to use an app. On day 30, this number drops to 6%. Singapore, on the other hand, lags behind Indonesia on day 1 retention but comes out a winner on day 30 with an 8% retention rate.
In Singapore, 83% of the total population are active on social media, compared to 42% on average in SEA.
Retention Rate by Country
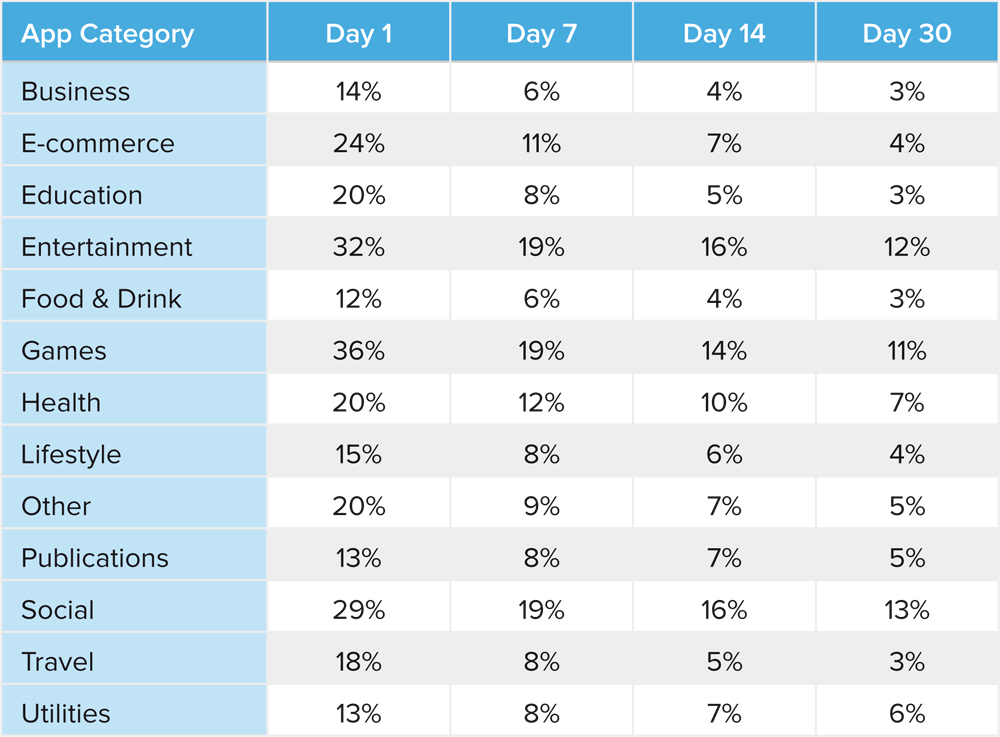
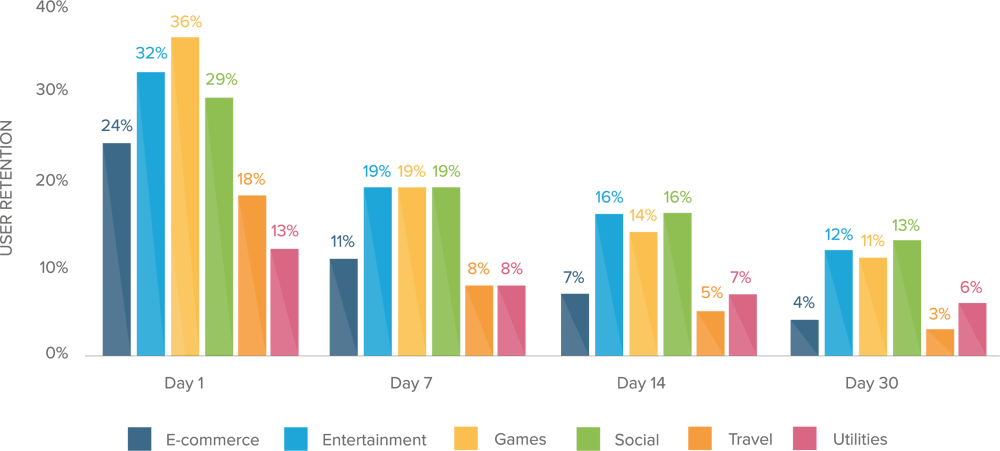
Retention Rate by App Category
Overall, Social Networking, Entertainment, and Gaming apps have the highest retention rates in the region. The stickiness of social media is a universal phenomenon, but in Southeast Asia specifically, higher retention rates are also due to its strong and growing network effect. Year over year, the number of people in the region who joined social media has grown by 14% in 2018, adding 224 million new users. To compare, this number has grown only 8% and +49 million new users in the United States.
The popularity of mobile entertainment comes as no surprise given that more people now own smartphones than TVs in some parts of SEA. Entertainment has the secondhighest retention rate (32%) in the region on day 1 and 30 (12%).
Gaming apps are also very popular in SEA, especially in Singapore, which scores in the top three countries globally in time spent playing video games, preceded only by the U.S. and Germany. Gaming apps have the highest Day 1 retention rate (36%) and the third highest on Day 30 (11%).
Retention Rate by Category: Day 1-30
Conclusion
Southeast Asia is quickly becoming the new land of opportunity for mobile publishers that are ready to embrace the challenges of this developing region.
Rising affluence, urbanization, and growing demand for convenience drive mobile growth in SEA and promise compelling revenue opportunities for mobile apps that successfully tap into these trends. But scaling user acquisition in this vast and diverse market is not an easy feat.
The good news: across the board, acquiring users in Southeast Asia comes at a bargain price compared to the more mature markets where mobile has become ubiquitous. At $1.58 per install, acquiring users in Southeast Asia costs 73% less than in the U.S. and 65% less than in other APAC countries (excluding SEA).
The challenge: even though installs cost less, scaling campaigns while achieving strong results deeper in the funnel can be an uphill battle. Regional diversity in culture, politics, religion, language, and income means that marketers need to double down their efforts on localization in SEA. As part of this challenge, seasonality affects shopper behavior in Southeast Asia more so than in other regions. For example, June, the month of Ramadan in 2018, had the highest cost for acquiring mobile users who make a purchase and the lowest conversion rate, signaling that marketers must carefully plan their campaigns around regional holidays for the best ROI.
The opportunity: across all geos, Android users cost less, but unlike in any other region, Android users in SEA also offer the best value for money. Android users not only cost 17% less than their iOS counterparts but also purchase at a higher rate (2.19% on Android vs. 1.81% on iOS). This phenomenon might mean that the stronger Android consumer segment in SEA is a global “exception” — or, considering the market’s potential, perhaps the new normal.
Acquiring users in Southeast Asia comes at a bargain price compared to the more mature markets where mobile has become ubiquitous.
Another significant area of opportunity is mobile shopping. Acquiring mobile users who install, register, and purchase in shopping apps costs less in SEA compared to the rest of the world. At the same time, purchase rates (the percentage of people who make an in-app purchase after installing an app) mirror the global benchmark (7%), signaling that Southeast Asia is about as ready to spend money on mobile as any other region in the world.
Finally, while the usage of mainstream social media is predicted to decline in North America, in SEA, it is on the rise. Social Networking is the stickiest app category based on the average day 30 retention rate, preceded only by Entertainment and Gaming.

Liftoff is a performance-based mobile app marketing and retargeting platform which uses post-install user data to run true cost-peraction user acquisition and re-engagement campaigns. Powered by advanced machine learning and lookalike targeting, Liftoff campaigns are optimized to drive actions beyond the install, like booking a hotel, making a reservation, or renewing a subscription.
Liftoff’s cost-per-action model helps customers scale and grow by acquiring users that actively spend in revenue-producing events. Headquartered in Palo Alto, CA with offices in New York, London, Singapore, Tokyo, South Korea and Paris, Liftoff works with leading app publishers and brands across the globe.
Fuel your Mobile Growth!