
Pitfalls of Modeling LTV and How to Overcome Them
Lifetime value (LTV) forecasting is essential for mobile app developers trying to understand the total value of their user base in quantitative terms.
Once calculated, predictive LTV has a plethora of use cases, including ROI-driven marketing automation, long term accounting forecasts, and user re-engagement (CRM). This article discusses why predicting LTV can be challenging and provides some insight on how it can be done effectively.
Challenge #1: Standard machine learning doesn’t fully solve the problem
Popular machine learning (ML) algorithms such as random forests, gradient boosted trees, and neural networks are tried and true approaches for finding complex patterns in data.
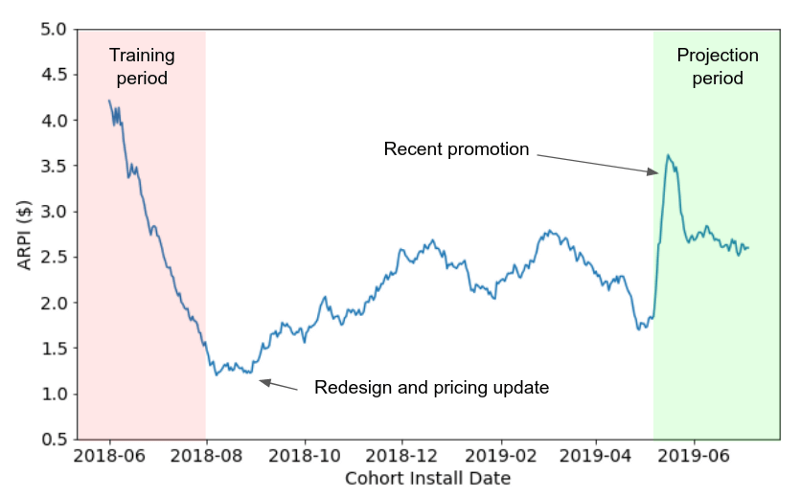
Practical LTV forecasting pushes the limitations of these approaches, which require extensive training, large test sets, and long historical records. To outright predict day 365 LTV, a model would require access to a large number of users with known (actual) day 365 LTVs available, i.e., users who began using a product at least a year ago.
Due to market changes, app updates, and changing UA strategies, the fundamental behavior of these older users can be different from new ones. Thus, a “pure” machine learning model by definition is always training on stale (years old) data.
Figure 1: ML-based forecasts for long term (1 year+) LTV forecasts must leverage data from users who are many months old. Historical data may include product redesigns, pricing upgrades, and promotions. And thus historical cohorts rarely represent the current behavior.
This may work for very stable products. However, most modern products experience app updates, pricing changes, and market fluctuations frequently. Thus, out-of-the-box machine learning alone doesn’t solve the problem.
Additionally, many products yield significant revenue from users who convert days or months after install (i.e. mobile games), or are “whale” driven with a small percentage of rare users driving the bulk of the cohort’s revenue.
ML models, in the context of LTV, also require backtesting to validate (i.e. training a model on a historical cohort, using it to predict a future cohort, and then checking against that cohort’s actuals). This procedure can be a lot more time consuming than typical cross-validation within a single training set, and also makes the assumption that past performance is indicative of current performance.
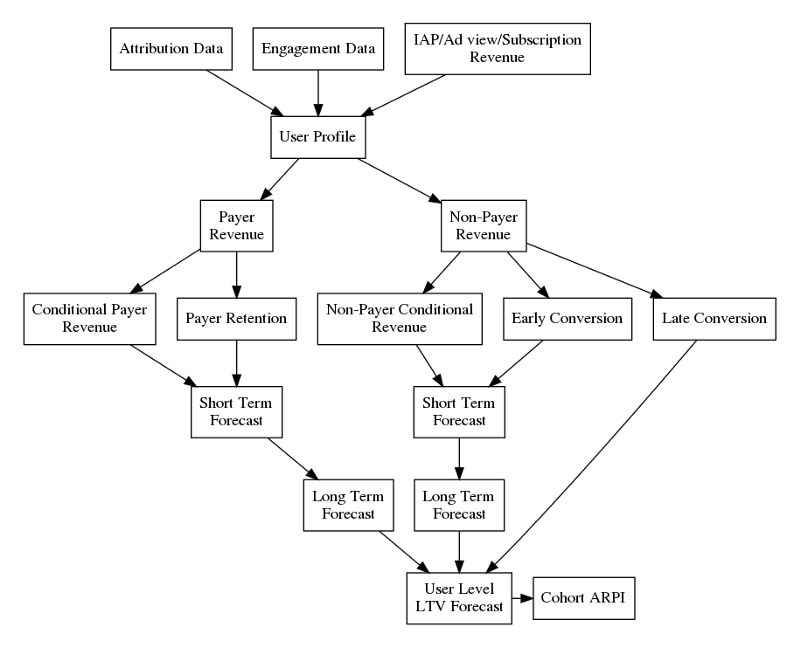
The graphic below describes the multiple submodels of our in-app purchases (IAP) forecasting system, which predict LTV for paying vs. non-paying users, and for the short term vs. long term. The individual outputs are then combined to produce a single LTV number for a cohort at a given horizon (number of days since that cohort began using the app).
Figure 2: An optimal approach to LTV modeling
Each submodel can have multiple theoretical foundations based on their applications, accuracy requirements, and scope. At AlgoLift, we’ve achieved success in LTV modeling with the following principles:
- ML: We use ML models when one can access a large quantity of relatively recent training data; for example, predicting subscription to a product at the end of a free trial. Recency is key because products undergo frequent updates and changes to monetization. Any model that relied on year old or older data to train would not be robust to this.
- In-app events: Tracking in-app engagements can help predict LTV, especially for non-paying users and young cohorts. Knowing how often someone is engaging with an app, or whether they completed a certain series of events, gives models an otherwise unknown insight into their purchase conversion probability.
- Model training data: Larger data sets are usually good for ML. However, we also dynamically and automatically choose what data to ignore. For example, holidays and promotions are automatically removed from training sets if those cohorts are significantly different.
- Bayesian methods: Parametric models may not be as sophisticated as their ML counterparts, but provide more extrapolation power. Bayesian approaches explicitly model heterogeneous or evolving user behavior and better quantify uncertainty. Additionally, they allow the flexibility to supplement predictions for newer apps with “priors” from comparable products.
- Secondary models: We use cohort level LTV models that have a different set of inputs and assumptions to validate our aggregated user-level projections. When both models line up, we can be more confident in the results; when they don’t, it’s indicative of possibly incorrect assumptions being made, or changes in dynamics that weren’t captured.
Under-scoping the data science (and data engineering) resources and skills sets required to build a functional LTV system seems to be one of the major pitfalls for companies trying to build this tool in-house. If it is built, the challenge becomes validation and adoption by users, and the most common sticking point is forecast accuracy.
Challenge #2: Everyone wants 100% accuracy all the time
Accuracy is hard! It is useful to break down the problem into two parts:
- Systematic bias: A systematic over or under prediction in a category (i.e. iOS vs Android users)
- Variance: Sample noise remedied by larger samples
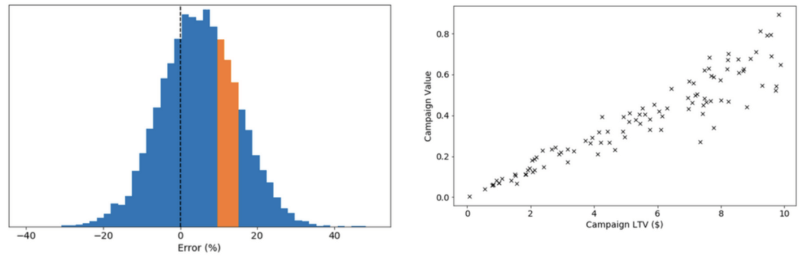
Figure 3: Example of (left) unbiased vs (right) biased model. Both models have the same variance due to underlying data noise. However, the biased model undervalues iOS and overvalues Android due to modeling error.

It is hard to avoid variance, especially in behavioral data (i.e., whales, product updates, data issues). Bias, however, can be reduced by identifying and addressing modeling flaws that remain present over a large sample size. To address bias, consider how your modeling system approaches:
- Categorical differences: Overvaluing a country platform or source
- Temporal changes: Overvaluing older installs by ignoring changing monetization or conversion dynamics
- Age: Overvaluing younger users compared with older ones
A good LTV forecasting system will have three key performance goals:
- Globally accurate: We aim for less than 10% error at day 365 when up to a month’s worth of users are aggregated to support confidence in high-level ROAS forecasts.
These forecasts are used to make the most consequential business decisions (i.e. deciding next month’s marketing budget) and so require the highest level of accuracy to ensure the best decision is being made.
-
- Unbiased over country/platform/channel dimensions: Marketers run campaigns across these dimensions; therefore, it’s important that our models correctly capture any LTV differences between them. If not, it can lead to biased decision making, where UA spend is incorrectly distributed across platforms or countries because LTV predictions do not fully account for the heterogeneity across them.
- Directionally correct at the campaign level: We want projections at the campaign level to drive intelligent decision making in the long term. Thus, accurate forecasts from early user behavior and low volume are necessary.
Figure 4: (Left) A histogram of LTV error for a hypothetical model with 10% global all accuracy. The orange slice represents a sub-set (for example tier 1 users only) which may have 17% average bias. (Right) Some models may predict a campaign score which increases with increasing LTV.
Posing the right question on accuracy in the right way (model bias and sample variance) is almost as hard as building a model to answer it. When assessing accuracy, think about your goal:
-
-
- For Return on Ad Spend (ROAS) forecasting or marketing automation, low sample size will cause large margins of error for each campaign’s ROAS. Therefore, think about an aggregate portfolio of campaigns where the overall ROAS has some bias and risk. Are you making the right portfolio decision on average over your entire spend?
- CRM also leverages user level forecasts, but the absolute number is not as important as the relative rank. When working with this goal in mind, also consider relative or directional accuracy. Is the true stack rank of day 365 revenue well predicted by LTV?
- Corporate financial models consider entire geos or sources and thus have low sample variance due to high volume. Here, being unbiased toward a specific category is most important. Are you over predicting your Tier 1 users?
-
Knowing the internal client’s needs and risk tolerance is essential for correctly directing R&D efforts, model improvements, and validation. Poor collaboration between end-users and the data science team can leave a partially or fully developed data science product mired in “accuracy” land. The next section provides a foundation for starting the conversation.
Challenge #3: Building models to satisfy many use cases
Once a user level LTV prediction is made, it can be used by a variety of corporate stakeholders. Each audience requires different levels of accuracy and granularity. It is critical to understand the final use case when scoping and designing an LTV model. While it is hard to satisfy every business need, ensuring the system is human interpretable may help development and adoption of an LTV forecasting system:
-
-
-
- Stability: What is a reasonable forecast update frequency? Frequent changes may signal inaccuracy. However, ignoring real surprising behavior that strongly changes LTV is also undesirable.
- Accuracy: What is an acceptable level of variance (sample size) and bias (model sophistication)?
- Temporal granularity: How soon after install does the forecast come? Is a cohort a week or a month? Different teams care about different temporal granularity and responsiveness.
- Cohort granularity: Does your end-user care about individual users, all users, or a country?
-
-
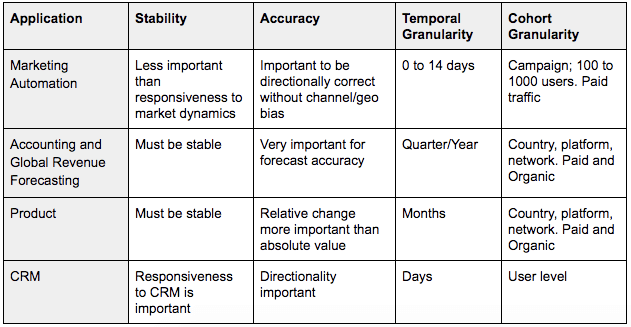
Table 1 illustrates some common use cases and requirements for LTV predictions as they relate to stability, accuracy, and granularity.
Table 1: Use cases of an LTV model and the requirements for each
Summary
Predicting user-level LTV is challenging and requires months, or even years, of dedicated data science and engineering efforts to set up robust, accurate production systems. However, the business value provided by user-level LTV is undeniably significant, offering solutions to a variety of use cases. Once an LTV forecasting system built upon solid methodology is put in place, it becomes a highly beneficial tool that can be used to quickly judge the success of marketing efforts, and to automate intelligent marketing decisions.