
NEW! 2018 Mobile Shopping Apps Report
The massive growth in mobile shopping apps and interest by shoppers who rely on apps every step of the journey, from research to purchase, has created a “perfect storm” for shopping app marketers. But a booming market is also a crowded one, where data on user demographics and activity is critical.
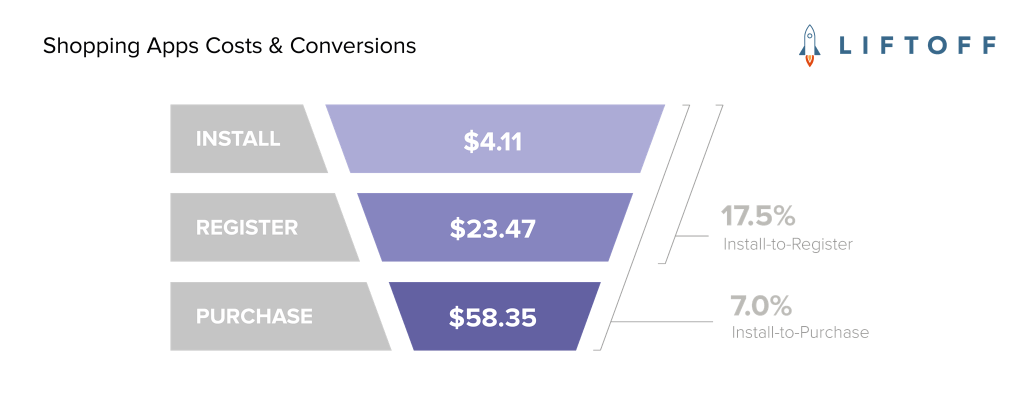
Download the 2018 Mobile Shopping Apps Report for essential data on user activity at key stages—Install, Register, and Purchase—to plan and prioritize tactics in a wider strategy to drive consumer connection and conversion.
The report draws from Liftoff internal data from April 1, 2017 through April 1, 2018, spanning 58.1 billion impressions across 10.2 million installs and 1.8 million first registrations and purchases. Acquire and engage high-quality mobile shoppers with insights including:
- Shopping app costs and conversion rates: install, registration and purchase events
- Break down of data by platform (iOS and Android)
- User demographic (gender) trends
- Regional trends (North America, LATAM, EMEA and APAC)
- Important monthly and seasonal trends
We are also hosting a webinar for an in-depth discussion on marketing shopping apps and the latest trends. Register now to save your seat.
If you are ready to achieve your shopping app goals with Liftoff, get started today!