2019 Mobile Shopping Apps Report: From Seasonal to Year Round Shopping
Our recently released 2019 Mobile Shopping Apps Report highlights user acquisition trends and benchmarks for shopping apps. The report reveals insights for key geographic locations at a global, regional, and country level.
The report also includes install, registration and purchase trends over an entire year’s worth of data. One key finding uncovers how seasonality is no longer impacting shopping trends as in years past. As shopping apps have become a more integral part of our daily routine, they have unlocked an “always shopping” habit of behavior. Based on the data, Business of Apps concluded many of these changes are due to retailers organizing shopping events year round, such as Amazon Prime Day.
In addition to the shift from seasonal shopping to year round shopping, we found several other noteworthy trends in the data:
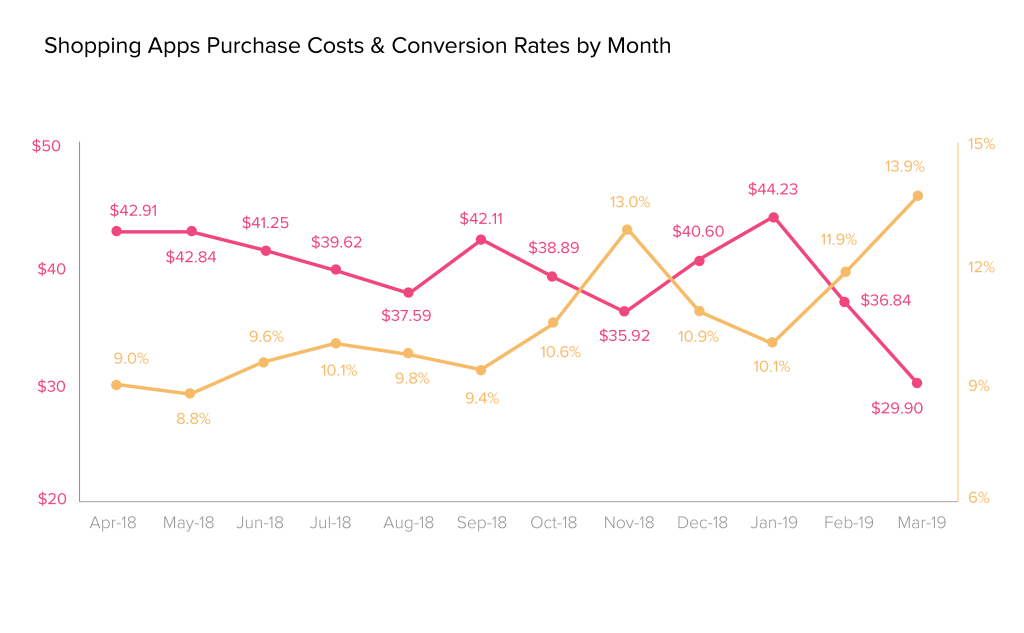
- Overall we see a stabilization in new user acquisition costs (first-time purchase) compared to previous years at $35-$40
- There are great opportunities throughout the year for new user acquisition
- November and March are standout months (high first-time purchase rates and low new user acquisition costs), ideal for investing into user acquisition
- During the months when conversion rates are low and acquisition costs are high (September & January), consider doubling down on re-engaging your existing users
Looking at year-over-year trends, new user acquisition costs dropped 32.5% since last year, while first-purchase conversion rates increased nearly 50%, further reinforcing the shift from brick and mortar shopping to mobile.
Download the entire report for more information on monthly trends for shopping apps, as well as data by platform, region, and retention rates.
This report is offered in English, Japanese, Chinese, Korean and Indonesian