
All (LTV) Models Are Wrong, but Some Are Useful
Modeling LTV is one of the least talked about topics in mobile app marketing, and for good reason: Building an LTV model is hard.
It’s far simpler to describe campaign budget optimization or how to scale UA of a mobile app at a high level than it is to describe the underlying models that drive the decision-making of these efforts.

British statistician George E.P. Box’s adage, “All models are wrong but some are useful,” still rings true today. His famous quote perfectly encapsulates the success criteria requirements of any statistical model, including an LTV model used for mobile performance marketing.
The two areas of success criteria for a model should always be:
- Accuracy
- Utility
To help you understand what we mean here, we unpack these two areas of success criteria for an LTV model, particularly for the use case of user acquisition in mobile app marketing. Let’s get to it.
Outline
Accuracy of an LTV model
Measuring the bias of an LTV model
Measuring user-level accuracy of an LTV model
The utility of an LTV model
1. Optimal monthly budget allocation based on cash flow
2. Ad network budgeting (media mix modeling)
3. Campaign-level bid and budget changes
4. Campaign-predicted ROAS measurement for SKAdNetwork
Accuracy + utility = optimal UA
Accuracy of an LTV model
An LTV model for mobile app marketing should be designed to project the long-term returns or revenue from installs of a mobile app or mobile game. In an ideal world, the model gives an accurate prediction as early as possible, ensuring that the projection can be utilized immediately for all use cases.
There are, however, tradeoffs between early prediction and accuracy. An LTV model uses historical data from all users of an app to predict how recently acquired users might behave. Early on in a user’s life cycle in an app, there’s little data available to predict how their spending behavior might evolve over time. If possible, it’s ideal to wait and see how user engagement changes over time in the app before making a prediction.
Accuracy itself can be measured in many different ways. Before making an accuracy analysis, you should be able to answer:
- What size cohort are you measuring accuracy on? (e.g. app/platform/ad network level)
- What LTV projection window are you analyzing? (e.g. D30/180/365)
- What is the age of the cohort you’re analyzing? (e.g. D1/3/7/14-aged installs)
- What performance metric are you using to measure accuracy? (e.g. bias/conversion accuracy/Mean Squared Error)
When thinking about accuracy performance metrics, you can analyze either user-level accuracy or cohort-level accuracy (bias). While it can be useful to understand how well the model is predicting individual users’ LTV, bias or directional accuracy is beneficial to understand if there’s a persistent over or under prediction on larger cohorts (e.g. platform- or ad network-level cohorts) and will be a better proxy for how the model performs in its core use case.
Measuring the bias of an LTV model
Bias, or cohort-level accuracy, shows whether predictions are over or under on average. To calculate bias, you can simply aggregate the average (mean) pLTV and compare it to the actual average revenue for a cohort. Typically, it makes sense to look at bias on larger cohorts, such as platform-level cohorts, where you can ensure, for example, that the predicted revenue from
both iOS and Android cohorts are correctly captured, as well as for major ad networks with significant volume for a particular app. To gather an accurate estimate of bias, it’s also important that you don’t use small cohorts whose errors are more controlled by random variation at the user level.
For example, it may seem like 1,000 users is a “large” cohort because our minds are hardwired to think of data in terms of normal distributions (bell curves). But taking a gaming app with a cohort of 1,000, for example, means the LTV ends up being dependent on around 10-20 users who become payers (assuming a conversion rate of 1-2%). So in this case, 1,000 users is a minuscule sample, and its prediction error will be driven almost purely by variance that drowns out any detectable bias.
Measuring user-level accuracy of an LTV model
User-level error captures how well an LTV model is predicting individual users’ LTV. We’d suggest two methods for viewing user-level performance:
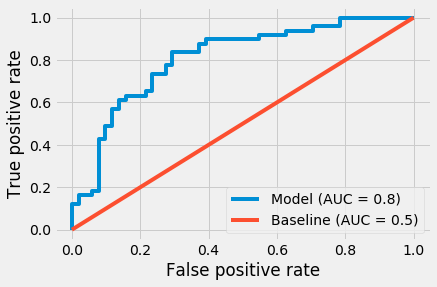
- Conversion accuracy: By viewing predicted conversion (payers) accuracy, which is a subset of LTV with less random variation than the dollar amount, you can see how well a model is distinguishing potential payers. A good metric to use for conversion accuracy is the Receiver Operating Characteristic (ROC) curve which measures the true positive rate versus the false positive rate at different thresholds, and the corresponding Area Under the Curve (AUC). A “perfect” model would provide an AUC of 1, while simply assuming a constant conversion probability would provide an AUC of 0.5. Although measuring the accuracy of predicting conversions works well for IAP, subscription, and e-commerce apps, it doesn’t work well with apps that predominantly monetize through in-app ads as most users tend to view at least one ad, making conversion rate less useful.
- Mean Squared Error (MSE): This captures the error in the full dollar amount, but MSE (or, RMSE, which is the square root) gives a number that isn’t very interpretable on its own. MSE is only really useful with another model as a benchmark, otherwise, we recommend limiting the analysis to bias and AUC for conversions.
With either metric, it’s best to measure accuracy separately at D1, D3, and D7 to see how much the error reduces as installs mature.
So far, we’ve outlined how to measure the accuracy of an LTV model but equally important to accuracy is how an LTV model is used.
The utility of an LTV model
A model that is sufficiently accurate but has immediate actionability can give you a significant competitive advantage over other companies vying for the same installs.
An actionable LTV model for mobile marketing can mean that:
- The optimal budget is allocated to acquiring installs based on the cash flow of the business
- Ad network budgets are recommended to maximize long-term return on ad spend (ROAS)
- Campaign-level bid and budget changes are programmatically implemented to effectively maximize ad network returns
- Campaign predicted ROAS (pROAS) measurement of iOS SKAdNetwork campaigns is possible to fuel points 2 and 3.
Let’s break down each of these points further.
1. Optimal monthly budget allocation based on cash flow
At the app level, the most effective use case for an actionable LTV model is for the optimal monthly budget allocation of mobile marketing activity. Underinvest in mobile marketing, and the business may not grow as quickly as it should. Overinvest in mobile marketing, and the business could run out of cash, halting marketing efforts — or worse, not make payroll. Effectively modeling the future cash flow based on the LTV of acquired installs ensures a mobile app business is optimizing their capital for future growth.
2. Ad network budgeting (media mix modeling)
An LTV model for app marketing should be able to guide you to spend on ad networks and ad platforms with the best pROAS, not only relying on historically observed ROAS. You can and should, however, take this one step further. If you only model the LTV of an ad channel, you’re not taking into account how much more spend a specific ad network can absorb before your overall app portfolio sees diminishing predicted ROAS.
If you model ad network incrementality as well as LTV, you can take a portfolio approach to determine the optimal distribution of budgets across all ad networks and platforms. This then answers the question, “How much more budget can I give to this channel?”, with an algorithmically driven approach.
3. Campaign-level bid and budget changes
The primary use case for modeling LTV for app marketing tends to be for campaign-level bid and budget changes. Though most app businesses use an LTV model to help guide their bid and budget changes made to ad creative sets, campaigns, keywords, and publishers, they seldom connect the LTV model to the changes made on the ad network with a programmatic approach. This results in a suboptimal outcome for the LTV model as there’s no feedback loop between the LTV model and the ad network spend, ensuring the optimal investment across campaigns.
An actionable LTV model connects the LTV prediction with the spend output on the ad network, delivering the maximal utility for arguably the LTV model’s most impactful use case. An optimization algorithm that models ad creative set, campaign, keyword, and publisher-projected ROAS can determine the optimal spend distribution across all campaigns. This type of optimization problem can and should take a portfolio approach, distributing ad spend where the best-predicted returns are expected.
This application of an LTV model delivers the most bang for your buck in terms of leveraging the output of the model to make the most impactful decisions for the success of your mobile performance marketing efforts.
4. Campaign-predicted ROAS measurement for SKAdNetwork
SKAdNetwork, Apple’s API for users who don’t share their IDFA with apps on iOS 14.5+ devices, reports performance at the campaign level with the tracking of post-install behavior of users limited to a short time window after install. The timer imposed by Apple significantly limits your ability to determine the LTV of your SKAdNetwork campaigns, leaving you to measure and optimize campaigns toward D0 events that you believe map to LTV.
In this new era of mobile marketing on iOS, modern LTV models have mostly become defunct on iOS for the use case of campaign performance measurement. Most modern LTV models today use ad networks or campaigns as central inputs for the model. SKAdNetwork makes it impossible for you to connect ad network or campaign data with rich in-app user revenue and engagement reporting.
An actionable LTV model can take the early data signals reported by SKAdNetwork, and combine those signals with a probabilistic attribution model that attributes predicted revenue to SKAdNetwork campaigns to output a campaign-predicted ROAS. An actionable LTV model such as this helps you to understand the long-term performance of SKAdNetwork campaigns, allowing you to update the performance of maturing cohorts (i.e. campaigns) as you learn more about the underlying user behavior.
Accuracy + utility = optimal UA
The performance of an LTV model should never be measured on just one vector. You can invest significant, ongoing resources to ensure a model is incrementally more accurate, eking out single-digit percentage improvements on any desired performance metric.
However, without ensuring the most amount of value is extracted from a model to improve your mobile marketing performance, the efforts spent fine-tuning your LTV model’s accuracy goes to waste. At the same time, a model that’s actionable but has directional or absolute accuracy deficiencies could result in mobile marketing investments made in the wrong places or, worst-case scenario, your business over invests. A balance between accuracy and utility of an LTV model should exist to ensure optimal performance of your UA marketing efforts.
Learn how you can directly optimize your LTV performance with Liftoff Accelerate LTV Optimize by signing up for the open beta today.