Measure Campaign Performance with Cohort Analysis
Update: even more dashboard enhancements have been added!
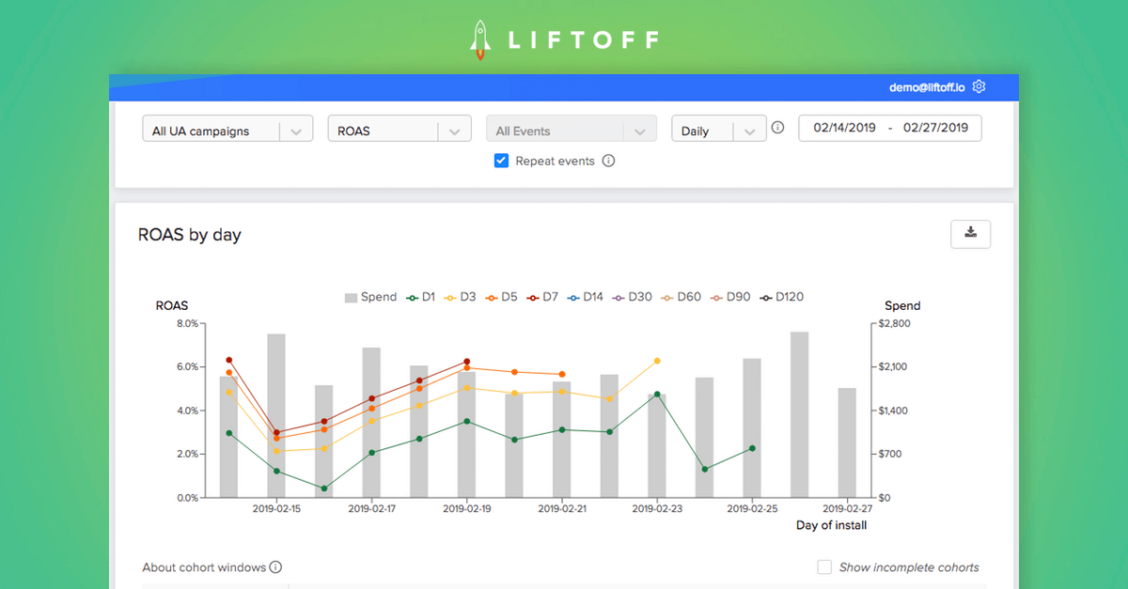
Today, we are releasing Cohort Analysis to your Liftoff Dashboard, providing greater visibility into your campaign performance. With Cohort Analysis, you can define your attribution windows more accurately and measure your most critical metrics over time. The Cohort Analysis dashboard is available for both user acquisition and re-engagement campaigns.
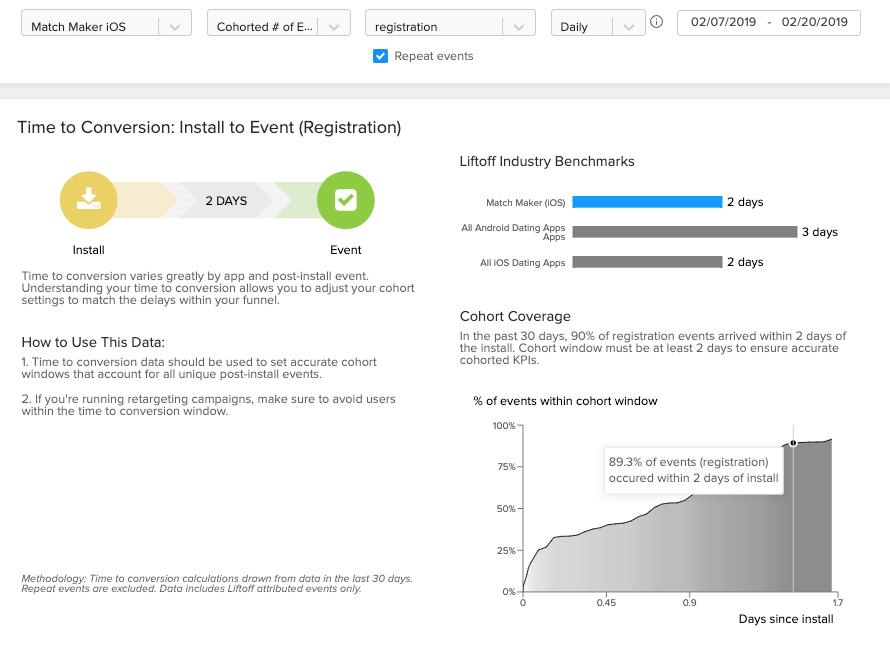
Understand your time to conversion
With the new dashboard, you can view cohorted performance over time and understand how long it takes for an average user to take an action after installing your app. Use the insights to set up more precise attribution windows and time your re-engagement campaigns correctly.
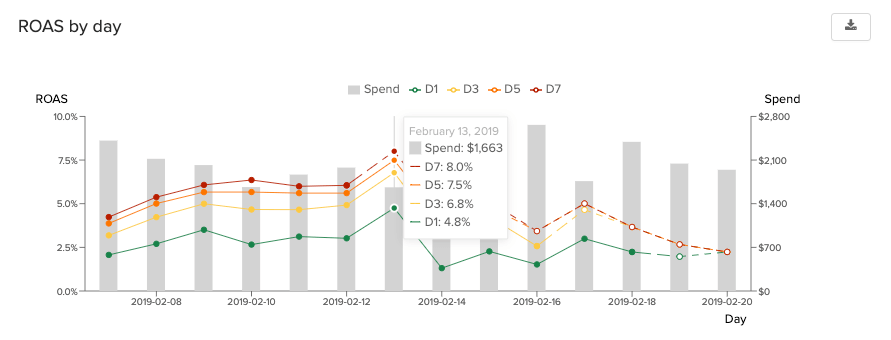
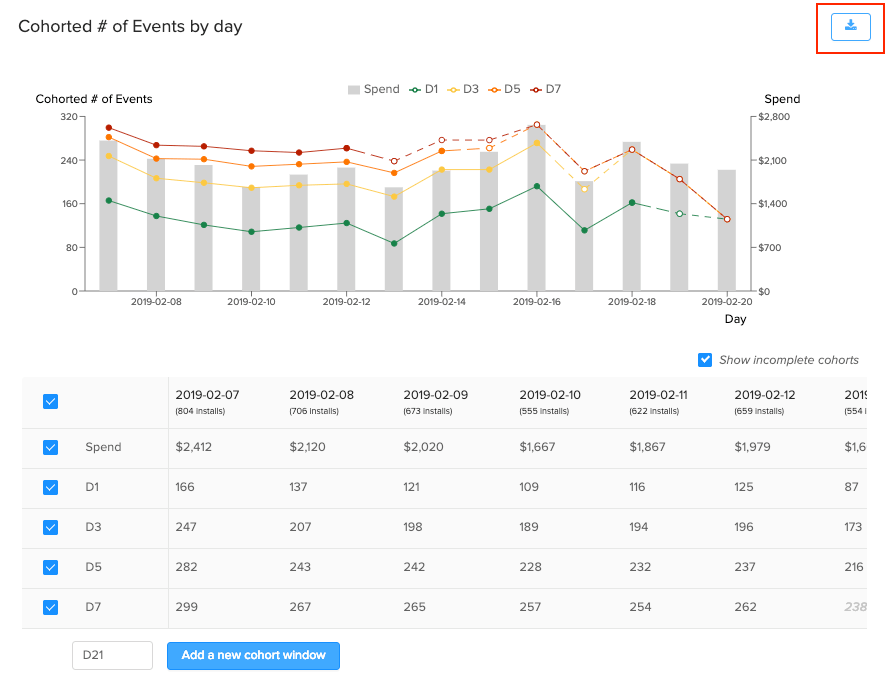
Track cohorted performance over time
The new Cohort Analysis dashboard visualizes the following cohorted metrics:
- Number of events
- In-app revenue
- CPA
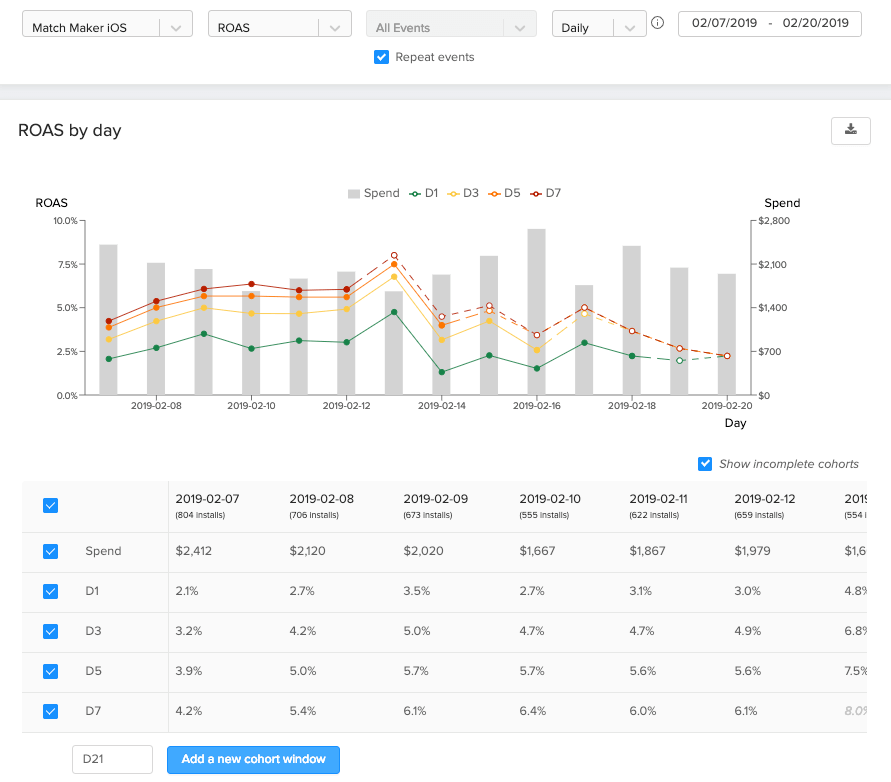
- ROAS
Simply select a date range to view cohorted data by installs (for UA campaigns) and clicks (for re-engagement).
Do more with your data
Export your cohorted data into a CSV file to analyze campaign performance and explore data trends. Access your data at the most granular level and explore the full-funnel impact over time.
The new Cohort Analysis dashboard unveils deeper performance insights, bringing more transparency to campaign reporting. Log in your Liftoff account or contact us to get started.