Mobile Shopping Apps
Report
2019 User Acquisition Trends And Benchmarks

Contents
Executive Summary
- Overall, shopping app users are more affordable to acquire and more apt to engage than ever before. The cost to acquire a user who makes a purchase is down nearly one-third compared to the previous year. Double-digit increases in conversion rates (in some cases nearly 50%) show users are primed for a purchase.
- Topline numbers indicate Brand Commerce and Value-Add apps are losing their grip. It could be tired creatives or poor UX, and marketers should perform an audit to find the disconnect. Marketplace apps enjoy the competitive edge, but should encourage loyalty — not rest on their laurels.
- From Singles’ Day to Mother’s Day, and from Cyber Monday to Super Bowl Sunday, consumer interest in shopping is continuous. Consumers are always shopping — so the practice of linking campaigns to seasonality and shopping events is somewhat passè.
- Users install shopping apps with a purpose. Retention starts high and tapers off over time, but loyalty doesn’t drop off a cliff overnight. It takes a full week for the retention rate to drop to 14%.
- A breakdown of data by region reveals install costs are lowest in APAC, while install-to-purchase rates are highest in EMEA. Users in more mature markets (APAC and North America) are a tough nut to crack.
- A review of costs and conversions across five key countries (Germany, Indonesia, Japan, the U.K. and the U.S.) shows Indonesia offers the lowest cost and the second highest install-to-purchase rate (trailing the U.K.).

Introduction
The meteoric rise of shopping apps – now firmly established as the essential “go-to” for inspiration and assistance, in-store and during all the micro-moments that make up the daily journey – has obliterated the linear path to purchase.
At one end, apps produce more opportunities than ever for marketers to interact with consumers and influence their buying decisions. At the other end of the spectrum, apps empower consumers to browse and buy on their own terms and timeline. Free of highfriction physical boundaries such as checkout lanes or parking lots consumers no longer go shopping; they are always shopping.
This dynamic is reflected in the increase in shopping app downloads worldwide reported by Apptopia, a provider of app analytics, data mining and business intelligence services. Overall, downloads grew to 5.70 billion, up nearly 10% over 2017. A breakdown of the data by operating system shows that Android downloads have grown 13.3% year-overyear to reach a total of 3.30 billion downloads. Apple’s iOS grew a comfortable 4.2% to reach 2.40 billion downloads.
Significantly, users install shopping apps with a high intent to peruse items and make purchases. The outcome is a massive increase in the total number of hours consumers spend in mobile shopping apps globally, a phenomenon reported by app store analytics provider App Annie. It reckons users spent a total of 18 billion hours in 2018 in-app, up 45% from 2016. But research suggests consumers aren’t just spending more time. They are also spending more money.
In 2018, shopping app users spent a total of 18 billion hours in-app, up 45% from 2016.
Indeed, 2019 marks the milestone year when m-commerce transactions are set to overtake e-commerce transactions, according to new forecasts from 451 Research. It calls out China as the driving force, noting it will become “the first country whose online spending exceeds $1 trillion with mobile devices as the primary gateway to digital commerce.” By 2022, m-commerce sales are projected to double to a total of $432.24 billion in the U.S. alone, according to research firm eMarketer.
By 2022, m-commerce sales are projected to double to a total of $432.24 billion in the U.S. alone.
Shopping apps are soaring in use and popularity, but competition for mindshare and share of wallet is also on the rise. To ensure their shopping app makes the cut, marketers must turn every session into an opportunity to drive usage, boost loyalty and prime purchases. This report equips app marketers to ensure their app remains at the center of the shopping experience.
The 2019 Shopping Apps Report draws from Liftoff internal data from April 1, 2018, through March 31, 2019 — spanning 90.9 billion ad impressions (90,932,926,448 to be exact, nearly double the impressions analyzed the previous year) across 13.6 million installs and 3.9 million in-app events. The mix and number of apps analyzed in this dataset can vary, which may result in more pronounced differences when comparing results this year with those reported the previous year.
Specifically, the report tracks costs and conversions globally, breaking down key engagement activities and trends to compare performance across regions (APAC, EMEA, LATAM and North America) and profile five countries (Germany, Indonesia, Japan, the U.S and the U.K.). The report offers additional granularity, breaking down shopping apps into three distinct categories (Brand Commerce, Marketplace and Value-Add) and highlighting periods of the year when marketers everywhere can double-down on campaigns to drive positive results for their business. It also reveals the precise amount of time (measured in hours and minutes) it takes for a user who has installed a shopping app to take action.
But effective campaigns don’t just focus on top-of-the-funnel activities; they drive deepfunnel goals and encourage lasting loyalty. To provide marketers the data and insights they need to define retention targets and benchmarks (and understand when their results fall short) Liftoff has partnered with Adjust, a mobile measurement company. The report integrates Adjust’s analysis of retention data (retention by Day 1, Day 3, Day 7, Day 14 and Day 30) across 2018. All this combined makes this report an essential read and one that equips marketers to define targets, assess trade-offs and set stretch goals well in advance of the busy shopping seasons ahead.
Shopping Apps Captivate a Global Audience
Overall Costs & Conversion Rates
As the Shopping Apps Costs & Conversion Rates graph shows, users are more affordable to acquire and more apt to engage. It’s a rare balance in costs and conversions that spells huge opportunity for marketers who hone campaigns to drive customer connection and conversion.
Shopping Apps Acquisition Costs YoY
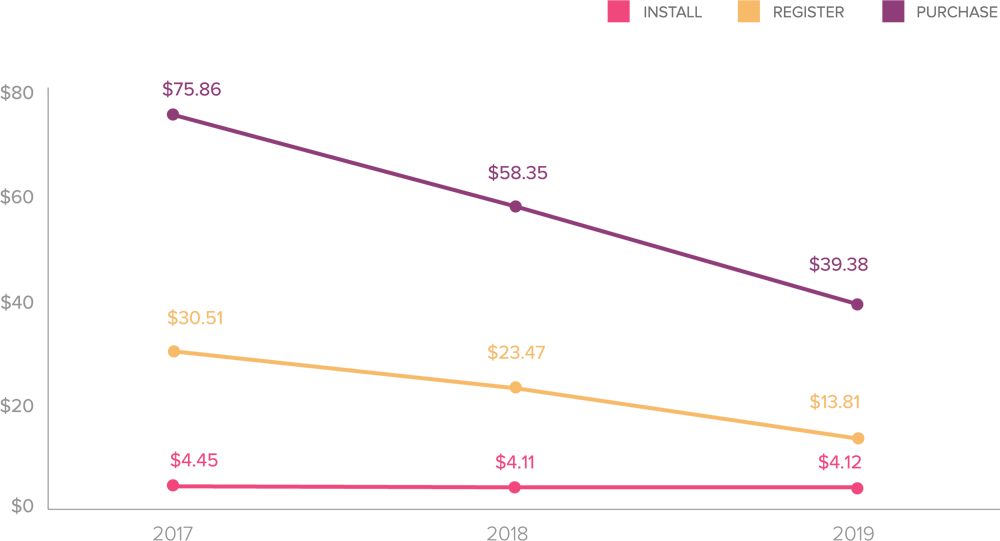
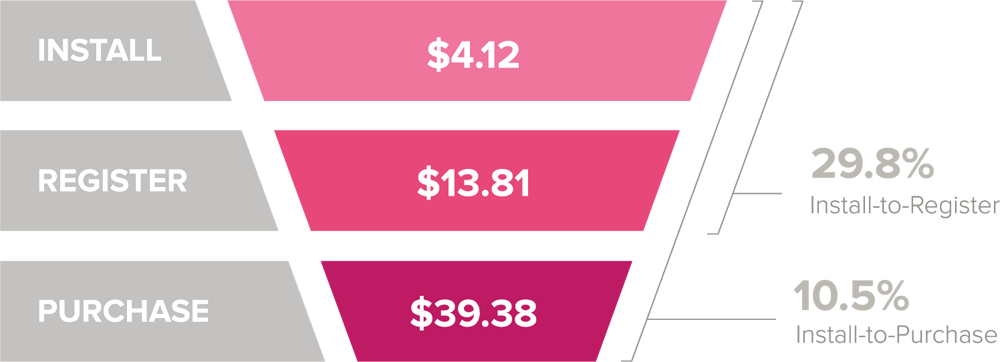
At the top of the funnel, it costs an average of $4.12 to acquire a new shopping app user. Deeper in the funnel, the cost to acquire a user who completes a registration is $13.81, down 41.2% compared to the previous year.
The cost to acquire a user who makes a purchase comes in at $39.38, down nearly onethird (32.5%) compared to the previous year ($58.35).
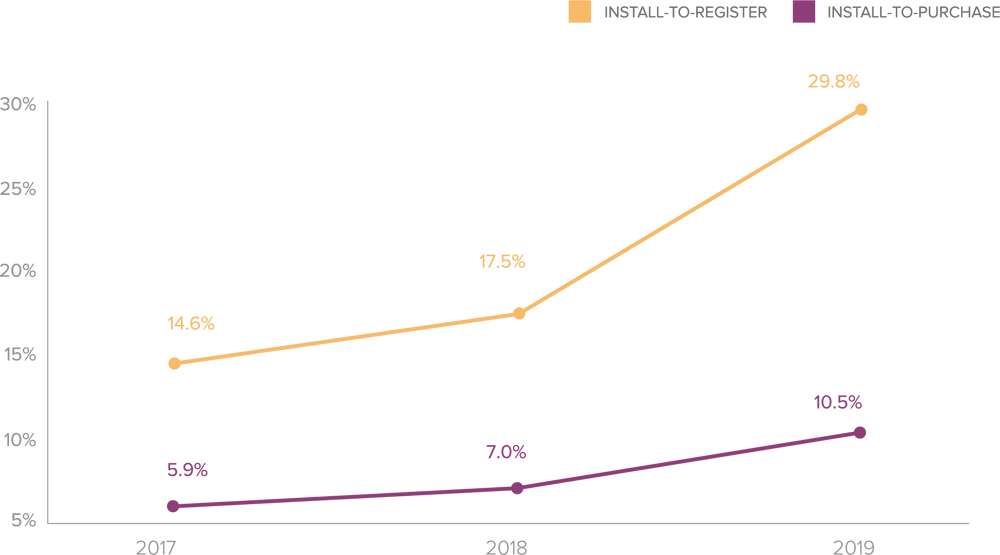
Double-digit increases in post-install engagement rates tell an even more positive story.
- The impressive install-to-registration rate of 29.8% (up 70.3% compared to the previous year), suggests users buy into the value offered by shopping apps. Now it’s up to marketers to gather the information and insights at this mid-funnel stage to turn interested users into active shoppers.
- At 10.5% the install-to-purchase conversion rate (up 49.1% compared to the previous year) shows marketers are on the right track to activate and motivate their audience.
Shopping Apps Acquisition Rates YoY
Shopping Apps Costs & Conversion Rates
The 2019 Mobile Shopping Apps Report breaks shopping data down into three categories, mapping user engagement activities to help marketers pinpoint the models and metrics to convert shoppers to buyers.
- Brand Commerce, an app offered by a company (under that company’s name/brand) that makes and sells its own branded products [Example: Gap].
- Marketplace, an app offered by a company that aggregates and sells products primarily belonging to other brands and merchants [Example: Alibaba]
- Value-Add, an app offered by a company that provides additional shopping value to the user beyond enabling a purchase [Example: Ibotta — which allows users to earn cash back on in-store and mobile purchases].
Brand Commerce Apps Cultivate Shopper Interest
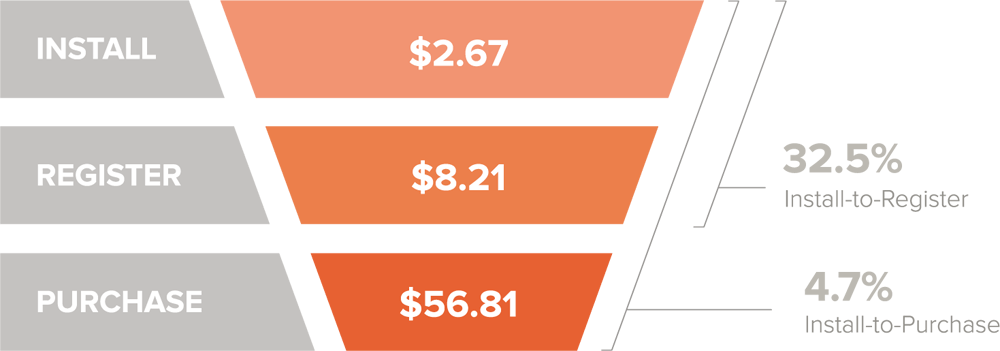
Costs: The cost to acquire users who will complete an action is down across the board. At $56.81 the cost to acquire a user who goes on to make a purchase, down 19.2% from the previous year, shows marketers are getting better at how they build on their built-in brand trust to boost genuine interest in their offers.
Conversions: At 4.7%, the install-to-purchase rate, down 43.6% compared to the previous year, is outright worrying.
The bottom line: It could be that users are frustrated with app friction at the checkout (or any number of UX shortcomings along the path-to-purchase). Or it may be that campaigns lack personalization or compelling messages — both necessary to make users an offer they literally can’t refuse. The data doesn’t tell us, but it does send a clear signal that marketers with this category of shopping apps have to do more to up their game.
Brand Commerce Apps Costs & Conversion Rates
Brand Commerce
An app offered by a company (under that company’s name/brand) that makes and sells its own branded products.
[Example: Gap]
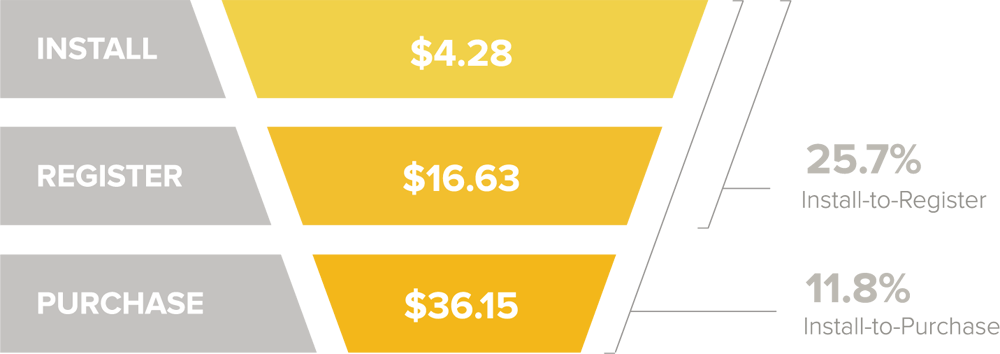
Marketplace Apps Cement Mass Appeal
Costs: Install costs increased marginally (up 6.7% compared to the previous year). However, this is offset by a significant drop in the cost to acquire a user who will complete a purchase ($36.15), which is a steal compared to the previous year ($80.02).
Conversions: At 11.8% the install-to-purchase rate is more than double the previous year, indicating users are open and eager to take the plunge.
The bottom line: The big players have the big wins. They don’t just capitalize on the overall trend to mobile shopping; they cover the bases (offering wide assortments, attractive prices and seamless experiences) to convince and convert users. Marketers with this category of apps should double-down on campaigns to increase usage and deepen engagement. Marketers with Brand or Value-Add apps can’t shift models to be mass merchant retailers or discounters – but they can win with campaigns that appeal to individuals, not the mass market.
Marketplace Apps Costs & Conversion Rates
Marketplace Apps
An app offered by a company that aggregates and sells products primarily belonging to other brands and merchants.
[Example: Alibaba]
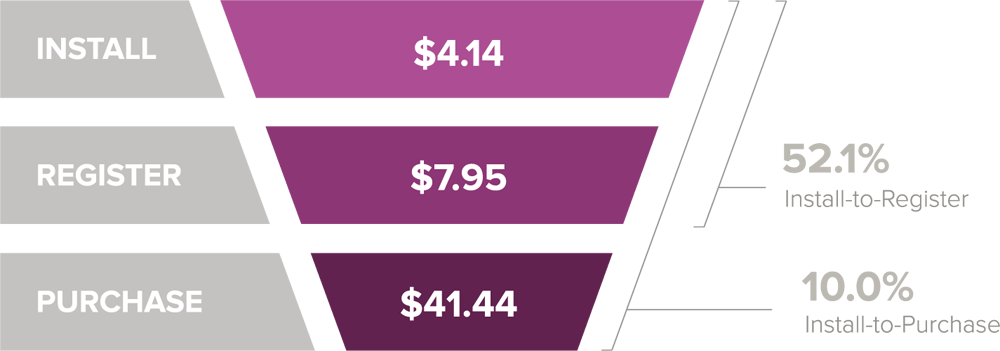
Value-Add Apps Convince, Not Convert
Costs: At just $4.14 the cost to acquire a user is down 17.7% compared to the previous year. Unfortunately, costs deeper in the funnel are pricey. The cost to acquire a user who makes a purchase ($41.44) is an investment that only pays dividends if campaigns can trigger frequent interactions and transactions.
Conversions: The install-to-purchase rate of 10% gives cause for concern, dipping by over half (55.1%) compared to the previous year. It’s a dangerous result since over half of the users who install an app also complete a registration.
The bottom line: Data indicates apps in this category are failing to strike a chord with their audience. It could be that Value-Add apps are failing to articulate their value proposition to users. Or it could be that tired campaigns need a refresh to stand out in a crowded market. Either way, marketers are advised to focus more effort and spend on campaigns to drive deep-funnel activities.
Value-Add Apps Costs & Conversion Rates
Value-Add Apps
An app offered by a company that provides additional shopping value to the user beyond enabling a purchase.
[Example: Ibotta — which allows users to earn cash back on in-store and mobile purchases].
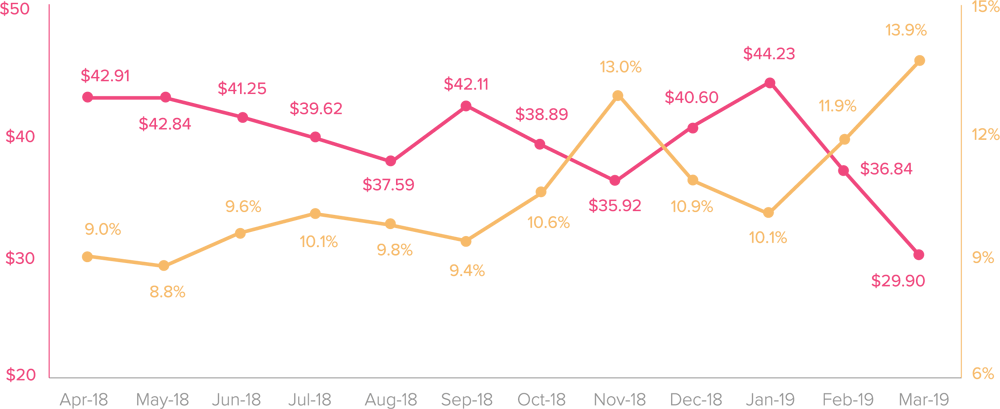
Seasonal Trends & Opportunities
Highs and lows across the curve are less extreme, indicating engagement with mobile shopping apps has become a more integral part of the daily routine and less impacted by seasonality. From Singles’ Day to Mother’s Day, and from Cyber Monday to Super Bowl Sunday, consumer interest in shopping is continuous.
- Heightened activity around shopping apps reveals a window of opportunity in March when the cost to acquire a user dips to a calendar low of $29.90, and install-topurchase rate hits a high of 13.9%.
- November, a month when users are primed to make purchases for Shopping Holidays like Black Friday, is another month when marketers can get value for money. Costs are moderate ($35.92) and engagement rates are impressive (13%)
- Overall, costs are stabilizing, hovering in the $30-$45 range, compared to the previous year when they were markedly more volatile and expensive.
Shopping Apps Purchase Costs & Conversion Rates by Month
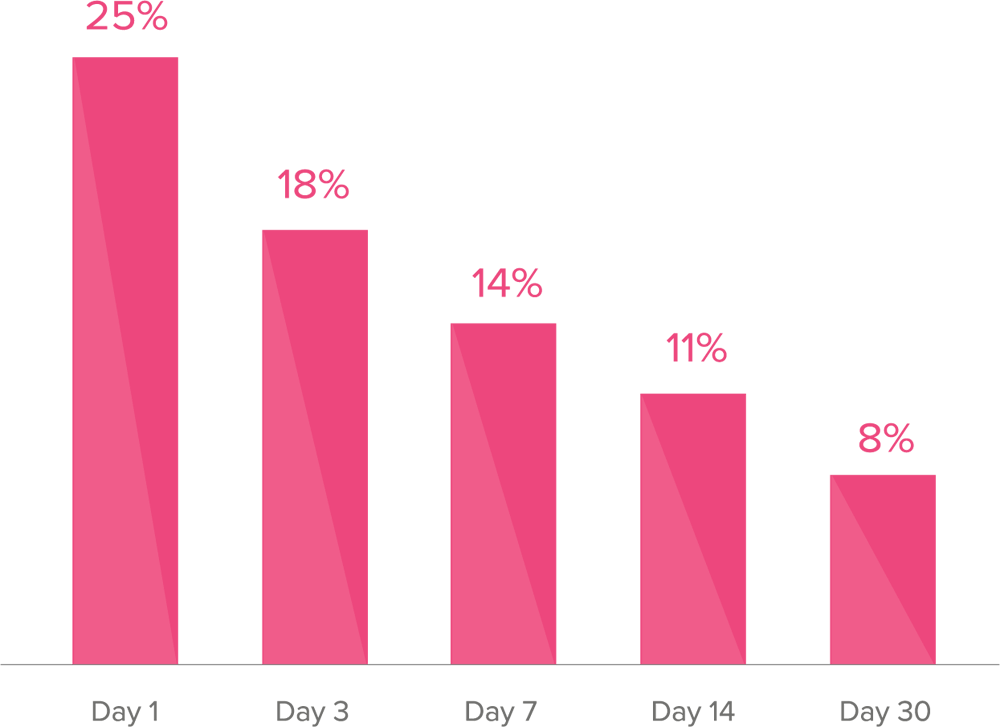
Retention: Engagement Intensity and Velocity
Costs and conversions indicate users have a high intent to engage with shopping apps. But do these users also have high retention? A review of data provided by Adjust shows 25% of users continue to use the app on Day 1. It’s a solid figure that indicates users are sticking around.
- Users install shopping apps with a purpose. This dovetails with recent research and insights from eMarketer. As principal analyst Andrew Lipsman observes: “Shopping apps likely get downloaded with greater intention, and there is less mystery about what utility that app is going to provide for the user.” It’s knowledge which marketers can “use to their advantage — making sure that, once [shoppers] get their app downloaded, they are doing everything in their power to keep customers engaged and transacting through the app.”
- It takes a full week for the retention rate to drop to 14% – a period that offers ample opportunities for marketers to swing the odds in their favor with engaging campaigns and relevant messaging to reignite interest and spark consumer connection.
- Retention hits single digits (9%) by day 28. If marketers want to garner users’ attention for the long term, then it’s high time to start re-engaging your shoppers.
Shopping Apps User Retention
Regional Analysis
Costs & Conversion Rates
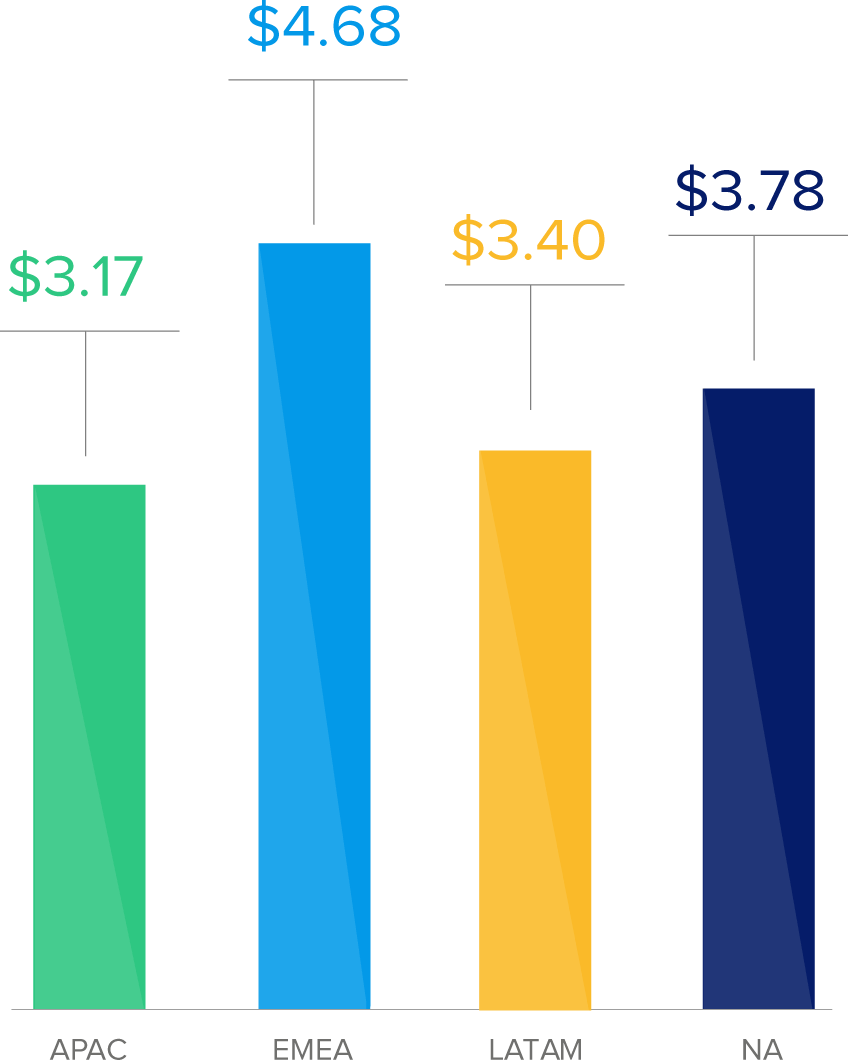
A breakdown of install costs by region (APAC, EMEA, LATAM and North America) reveals that the price of installs has increased in most territories.
- APAC, a region where shopping app growth is soaring, offers CPIs that are at the low end of the scale ($3.17).
- Significantly, CPIs are high in EMEA ($4.68) — but so is the probability that users from this region will convert deeper in the funnel.
- CPIs in LATAM are hardly a bargain. But the region is also no longer a sleeping giant. Consumer interest and activity is wide awake and on the rise. In fact, 2018 marked a milestone year when mobile, for the first time, made up more than one-quarter (27.5%) of all LATAM retail ecommerce sales.
- North America is a mature market where CPIs are pricey, but likely to pay dividends deeper in the funnel.
Shopping Apps Install Costs by Region
Shopping Apps Register & Purchase Costs & Conversions by Region
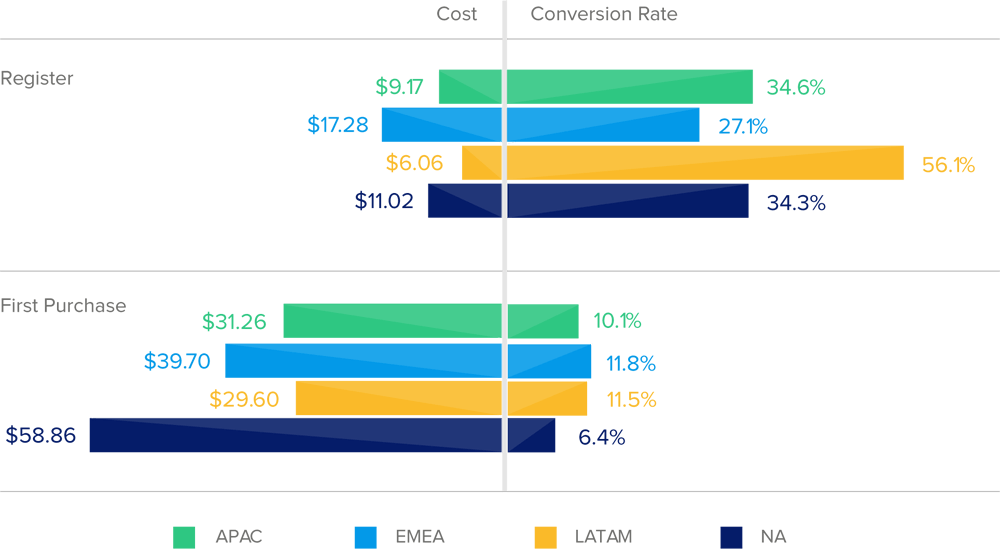
Register:
Registration, an important mid-funnel engagement event when users volunteer the data marketers can harness to deepen the relationship, is a low-barrier activity. Fortunately for marketers, costs have also hit their lowest yet.
- At $6.06 LATAM offers value for money (compared to $23.03 the previous year), and the install-to-register rate of a massive 56.1% (compared to 8.9% the previous year) indicates campaigns that strike a chord could strike gold as well.
- In APAC the cost to acquire a user who completes a registration ($9.17), down 52% from the previous year ($19.30) is attractive. At 34.6% the install-to-registration rate comes in at the high end of the scale, nearly 3x the rate the previous year (12.4%).
- In North America users are receptive and ready to engage. The cost to acquire a user who registers comes in at $11.02, and has dropped an incredible 8x from its high of $116.06 the previous year. Conversion rates are also favorable, rocketing 8x to reach 34.3% (compared to 4.6% the previous year).
- Costs and conversion rates in EMEA indicate it’s a region of extremes. At $17.28 the cost to acquire a user who completes a registration is the most expensive (down only 38% from its price tag of $27.64 the previous year). The conversion rate (27.1%) is the lowest, but more than double the previous year (11.5%).
Purchase:
Predictably, costs and conversions vary according to region, and the observation that deepfunnel engagement activities often come at a higher price is supported by the data. However, a deeper dive reveals rare exceptions to the rule that spell opportunity for marketers.
- A prime example is LATAM where mobile payments infrastructure is paving the way for consumers to interact and transact in greater numbers than ever before. At $29.60 the cost to acquire a user is a bargain (compared to a massive $261.93 the previous year), and the install-to-purchase rate of 11.5% (one of the highest in the data set and 14x the rate recorded the previous year) is a definite bonus.
- EMEA is a region where consumer interest in shopping apps, low in the rankings the previous year, is rising into the stratosphere. The price tag of $39.70 to acquire a user who makes a first purchase (compared with $55.53 the previous year) indicatesan audience primed to shop. The conversion rate of 11.8%, 2x the rate reported the previous year, is remarkably positive, and spells profits for marketers that can capture shopper interest and inspire action.
- Increased costs and moderate conversion rates is not a surprising combination in a highly developed and competitive market where consumers are spoilt for choice. This is clearly the case in APAC, where the cost to acquire a user who makes a purchase comes in at $31.26 (up 13.3% from the previous year). The conversion rate of 10.1% (up 16.9% from the previous year) is rather lackluster for a region populated by the shopping addicted.
- North America also has its share of challenges. At $58.86 the cost to acquire a user who makes a purchase is nearly 2x the previous year. Unfortunately, this increase is matched by a drastic decline in conversion rates, dropping nearly 60% to reach 6.4%, compared with 16.0% the previous year.
Retention
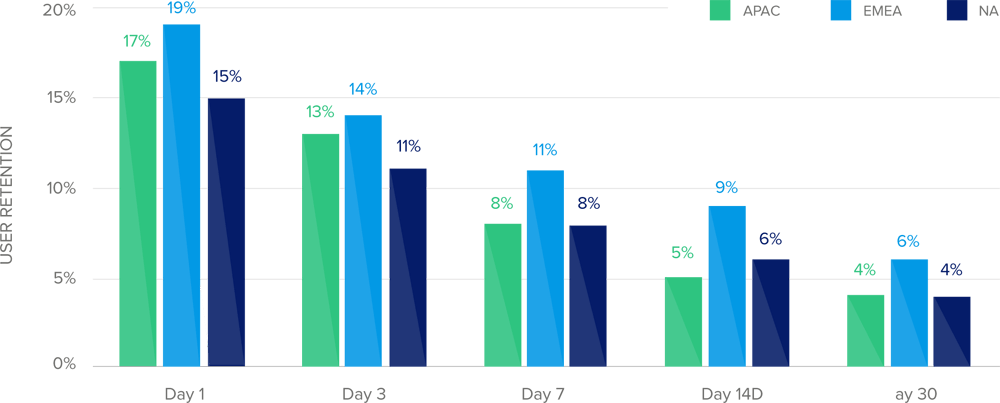
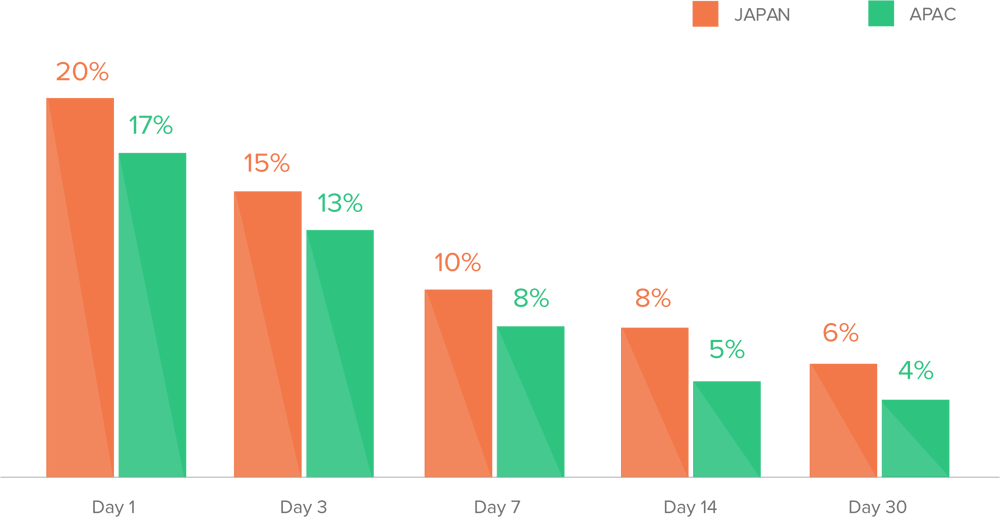
A breakdown of Adjust retention data across regions (APAC, EMEA and North America) helps marketers understand the deeper dynamics of app loyalty and the rate at which highly engaged shoppers can lose interest — particularly if messaging and campaigns fail to grab attention and drive action.
- EMEA is the hands-down winner, consistently reporting the highest retention rates at every stage (from Day 1 through Day 30). After trailing mature markets, this is a market on the move populated by shoppers that install shopping apps with high intent.
- APAC and North America are tied for second place at Day 30. While both start with retention rates comparable to that of EMEA (APAC – 17%, North America – 15%), the gap closes quickly by Day 7, when retention rates in both regions reach 8%. At Day 14, the decline continues (with only one percentage point separating the regions), and then dips again on Day 30 to 4%. It’s a disappointing dynamic for markets where shopping has become an integral and essential part of daily life (and where analysts say audiences are warming to ordering still more items, such as groceries, using mobile and apps).
Shopping Apps User Retention by Region
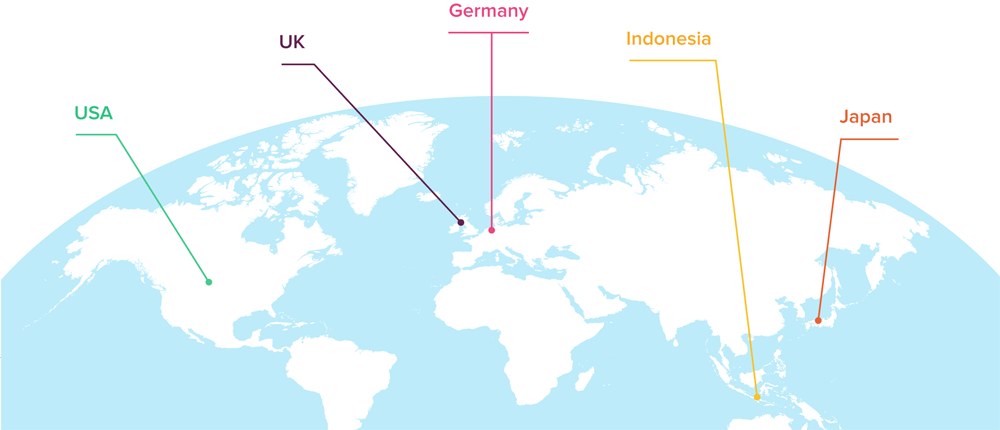
Key Countries: Attractive Markets by the Numbers
Think global and act local is the first rule of successful business and shopping apps are no exception. Armed with analytics about regions marketers can aim high.
But, without visibility into local metrics, contexts and benchmarks, they can miss their targets by a mile. This year the 2019 Mobile Shopping Apps Report breaks new ground, distilling hyper-local data around costs, conversions, retention and the install-to-purchase timeline (across Germany, Indonesia, Japan, the U.K. and the U.S.) to provide marketers actionable insights to gauge performance and rocket results.
Germany
Germany is a country marked by contradictions. Germany is the more-developed market, with a higher share of digital sales attributable to mobile and a greater proportion of Internet users shopping via a mobile device. However, concerns about personal data privacy and cybercrime combine to put a damper on mobile shopping usage — which is why research firm eMarketer forecasts mobile retail growth for 2019 will be 12%, down from 14.9% in 2018 and well below Western Europe’s 19.3% average.
Costs & Conversions: Promising, but Pricey
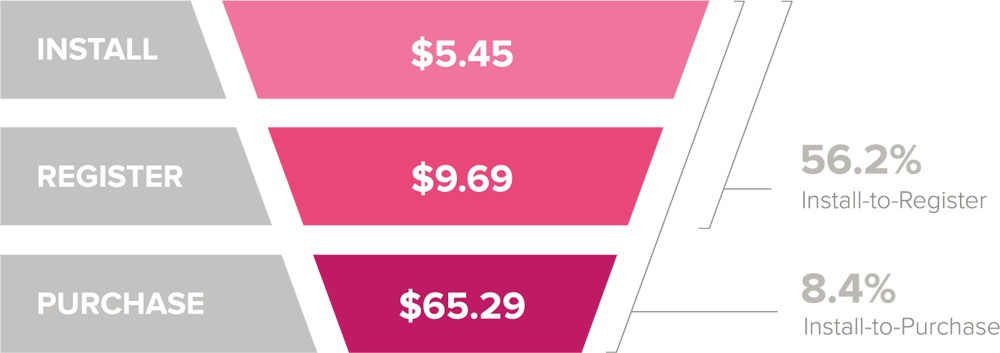
- At $5.45, install costs in Germany are pricey. They’re 16.5% higher than the install cost of $4.68 recorded for the region (EMEA). Deeper in the funnel, the cost to acquire a user who makes a purchase ($65.26) is no bargain, coming in as the most expensive of the five countries analyzed in the report.
- The install-to-purchase rate of 8.4% is somewhat lower than the 11.8% conversion rates recorded for the region.
Germany Shopping Apps Costs & Conversion Rates
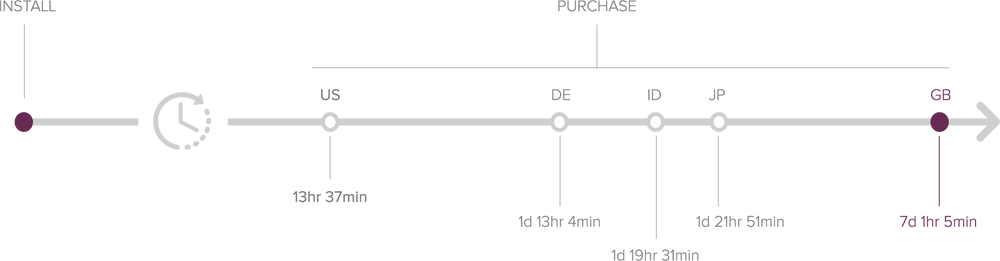
Time to Purchase: Fast Movers
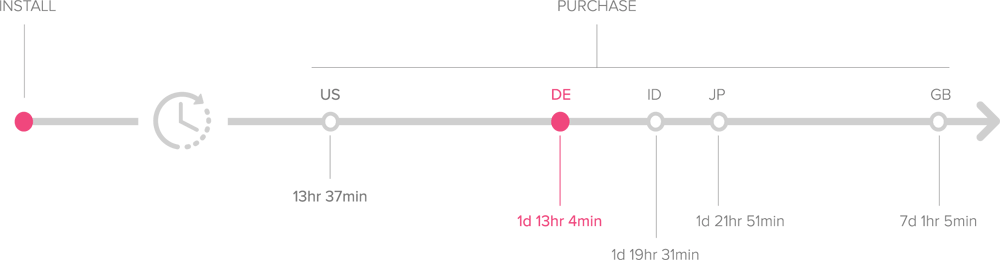
At 1 day, 13 hours and 4 minutes, the timeline for German shoppers to take action comes in second only to the U.S. While German shoppers may do some research before taking the plunge, they download with a clear purpose in mind and are comparatively quick to make their move.
Germany Shopping Apps Time from Install to Purchase
Retention: High Intent Indicates High Value
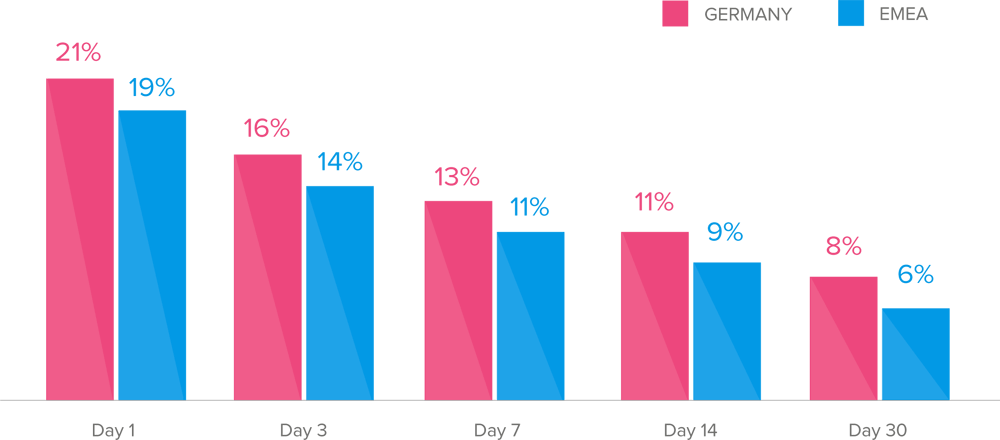
Retention data shows German shoppers don’t just download shopping apps with a sense of purpose, they also stick around for the long haul. Retention rates are higher across the board than the regional average, suggesting that strong interest in using shopping apps is in perfect balance with robust engagement rates recorded post-install.
Germany Shopping Apps User Retention
Indonesia
Rising affluence, urbanization and increasing demand for convenience are fueling the rapid growth of the Indonesian internet economy, on track to grow to $100 billion by 2025, up from $27 billion in 2018. The country, an oil-producing nation of 261 million people, has also become a hotbed of mobile innovation and home to “super apps” and mobile-first “unicorns” like Go-Jek. In April, Go-Jek quietly and cleverly rolled out Go-Mall, a new feature that lets Go-Jek users browse and shop items from groceries to electronics. It’s just one app company betting big on the massive growth of mobile commerce and shopping, enabled by an explosion in mobile payments.
Indonesia has been crowned the “most dynamic market” in South East Asia.
Costs & Conversions: All Systems Go
Indonesia has been crowned the “most dynamic market” in South East Asia (as measured by the growth of the Internet and the advance of online commerce). Liftoff internal data adds to the accolade, declaring the country extremely attractive for user acquisition and action.
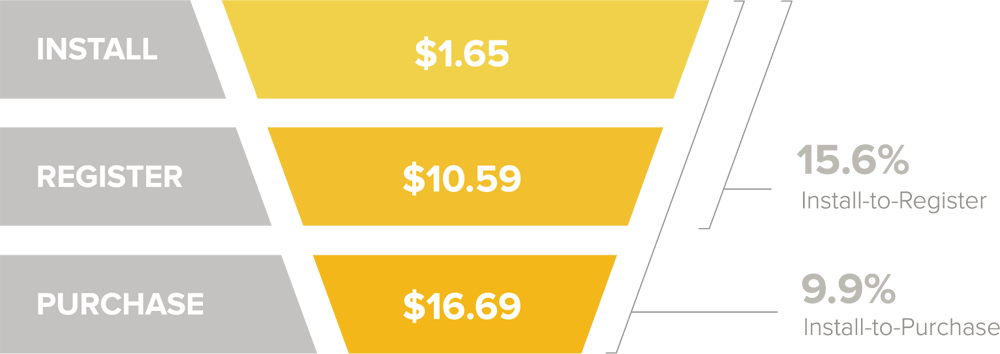
- At a mere $1.65 the cost per install is by far the cheapest among the five countries analyzed in this section. Moreover, the cost to acquire a user who makes a first purchase is also a steal at just $16.69 in a country where major key metrics indicate an epic shift in consumer behavior towards mobile app uptake and mobile commerce.
- Fortunately, low costs are paired with impressive conversion rates. At 9.9% the install-topurchase rate is aligned with the 10.1% rate recorded for the APAC region.
Indonesia Shopping Apps Costs & Conversion Rates
Time to Purchase: Slow Starters
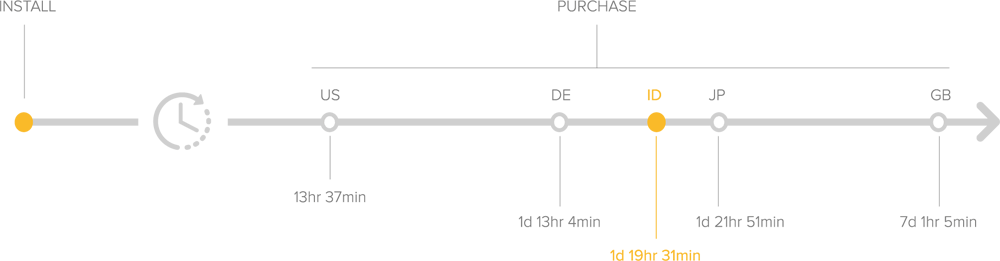
Clocked at 1 day, 19 hours and 31 minutes from install to action, Indonesia is sandwiched between Germany and Japan, two powerful economies synonymous with high purchasing power and a healthy uptake of shopping apps. Clearly, Indonesian users take slightly longer to commit to a purchase, but this is likely to change as more homegrown commerce apps such as Go-Jek help make mobile buying the new normal.
Indonesia Shopping Apps Time from Install to Purchase
Retention: High Intent Slows to a Trickle
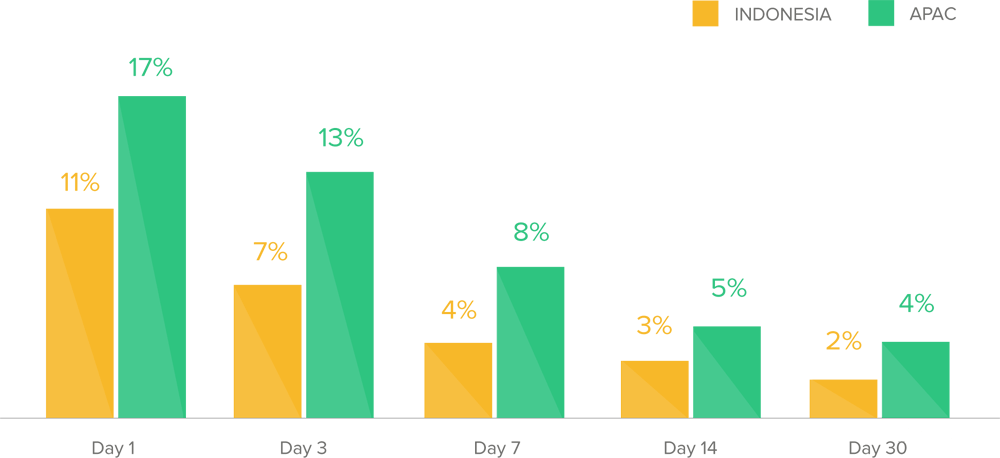
Unsurprising for a market just warming to shopping apps, retention rates in Indonesia trail behind those recorded for the APAC region. However, the low levels may not be a direct reflection of the appeal of apps or the effectiveness of engagement campaigns. Retention starts out at 11% on Day 1 and drops to 4% by Day 7. This may be an indication that consumers, many already low on the learning curve, are frustrated by the onboarding process or fail to understand the value the app offers in the first place. In both instances, the right message in the right context could streamline onboarding and ignite interest.
Indonesia Shopping Apps User Retention
In Japan, mobile drives a massive 70% of fashion sales and nearly 60% of all online transactions take place on mobile platforms.
Japan
Japan is a sophisticated and exciting market where users are accustomed to shopping on the long commute to city centers such as Tokyo, offering marketers a clear time window for promotions. It adds up to serious money, and research firm Statista forecasts mobile commerce sales in Japan will grow to $60.8 billion in 2020, up nearly 2x from 2016. A key driver is the resolve of the Japanese government to increase cashless payments to 40% of transactions by 2025, up from 20% in 2016. Fashion is one shopping category where this vision is a reality. Already mobile and apps drive a massive 70% of fashion sales. Overall, nearly 60% of all online transactions take place on mobile platforms, and the recent move by commerce giant Rakuten to let shoppers pay via QR codes scanned with a smartphoneis sure to accelerate the consumer shift to mobile and apps.
Costs & Conversions: Requires Effort, but Yields Results
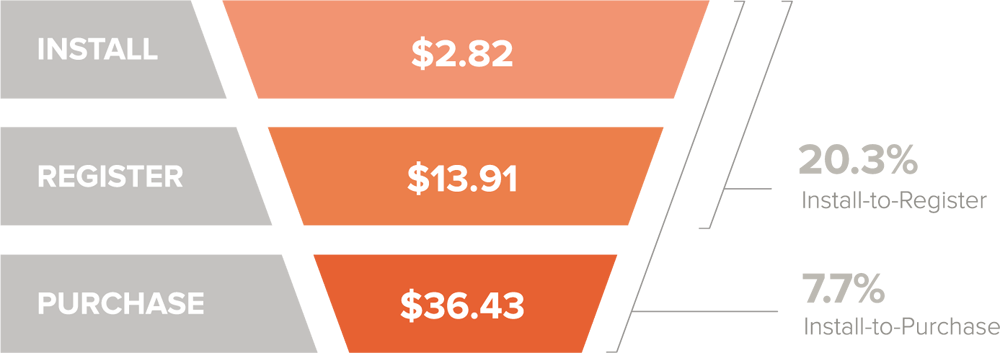
- At $2.82 install costs in Japan come in at the lower end of the scale (second to Indonesia with $1.65) and a comfortable distance from the U.S., where install costs are more than a third more expensive. The costs to acquire a user who makes a purchase ($36.43) is marginally more expensive than the rate recorded for APAC ($31.26).
- The install-to-conversion rate (7.7%) is lower than the rate for the region (10.1%), turning up the pressure on marketers to close the gap with attractive offers and effective targeting.
Japan Shopping App Costs & Conversion Rates
Time to Purchase: Thoughtful Shoppers
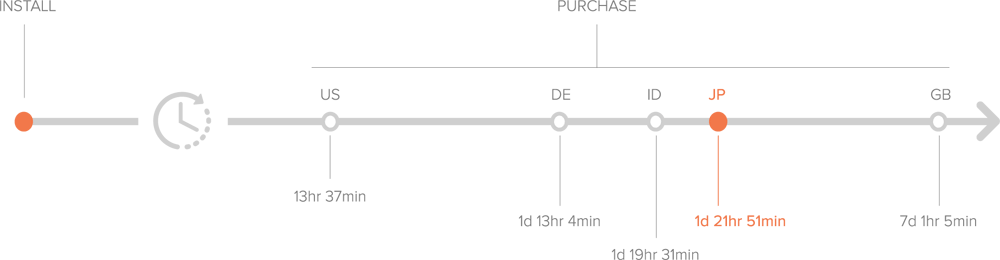
Coming in at 1 day, 21 hours and 51 minutes, the time to purchase for Japanese shoppers weaned on mobile is rather underwhelming. It’s a clear indication that competition for mindshare and wallet share is fierce, calling on marketers to be creative and effective in how they identify and address their target audience.
Japan Shopping Apps Time from Install to Purchase
Retention: High Intent Drives Longer Impact
It’s not a walk in the park to convert Japanese shoppers, but the efforts have their upside. Retention rates at every stage are somewhat higher than the rates recorded for the region, indicating Japanese shoppers are genuinely interested in interacting with their apps. Significantly, the 20% retention rate on Day 1 is the highest observed in this report (coming in a slim 1% above the EMEA average). Retention remains in the double digits through the first week, hitting a respectable 10% on Day 7, suggesting Japanese shoppers are faithful, not fickle.
Japan Shopping Apps User Retention
United Kingdom
The U.K., one of the first countries in Europe to embrace key shopping events, including Black Friday, and currently leading the region in buying groceries online and via apps, has developed a strong affinity for mobile shopping. In 2018 the smartphone, which accounted for 40% of online sales, became the dominant device for buying online in the U.K., according to quarterly data from the IMRG Capgemini e-Retail Sales Index. Advancements in mobile payments, in-app purchases and the efforts of retailers to optimize apps and websites all contribute to the central role mobile now plays in the shopping routine. Ironically, the impact of Retail-geddon, which saw 2,481 stores, banks and other high street businesses disappear from Britain (40% more closures than in 2017) is seen as a massive boost to mobile shopping as consumers switch to buying online. However, low consumer confidence and rising concerns around Brexit are moving consumers to rein in spending, not increase it.
Low consumer confidence and rising concerns around Brexit are moving consumers to rein in spending.
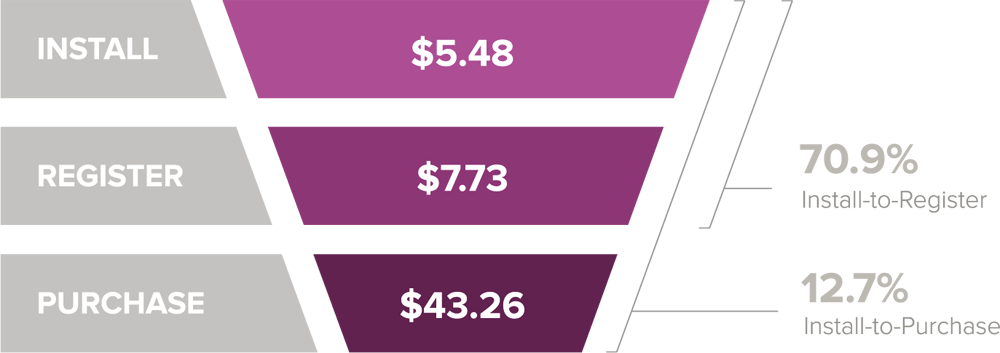
Costs & Conversions: Eager, but Anxious
- High competition for shoppers from bricks-and-mortar retailers fighting for survival and high anxiety about life in a post-Brexit Britain combine to push install costs through the roof. At $5.48 the U.K. is the most expensive of the five countries in this section, and towers above the $4.68 install cost recorded for the EMEA region.
- While users may be troubled by macro-economic developments, this doesn’t entirely dampen their shopping enthusiasm. The install-to-purchase rate of 12.7% is the highest and even outperforms the region (11.8%). The moderate price tag for a first purchase ($43.26) offers value for money in a country where mobile has just recently eclipsed desktop and tablet to become the dominant shopping device.
UK Shopping Apps Costs & Conversion Rates
Time to Purchase: Cautious Planners
At 7 days, 1 hour and 5 minutes, the time from install to first purchase in the U.K. is by far the longest, but it’s also what you would expect in a country where shoppers know their market value. Inundated by offers from retailers desperate to make a sale, users can (and apparently do) take their time and shop around for the best prices.
UK Shopping Apps Time from Install to Purchase
UK Shopping Apps User Retention
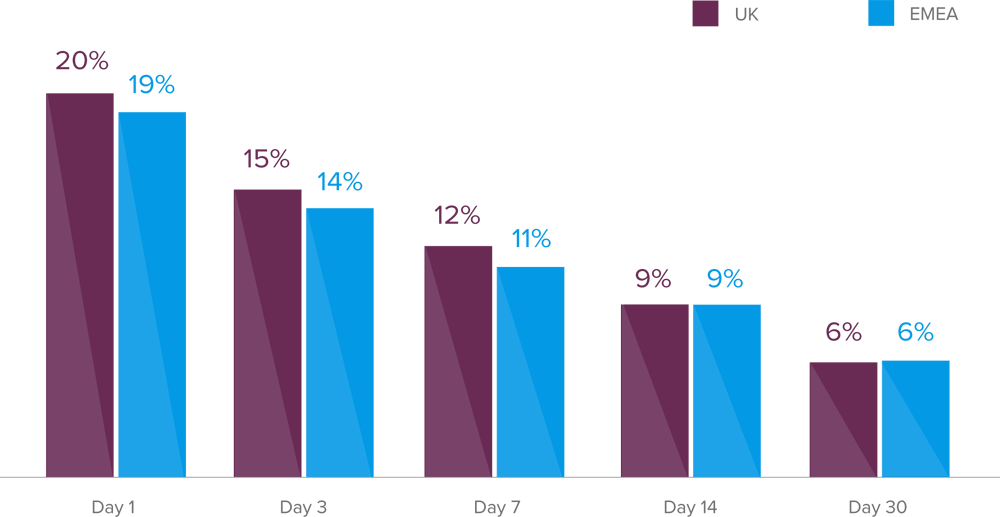
Retention: High Intent With Longer Staying Power
U.K. shoppers may be costly to acquire and difficult to convince. But retention rates, which keep pace with the rate recorded for the EMEA region at every stage, show these shoppers are also committed. Now it’s up to marketers to make sure users open to interacting with shopping apps also open up their wallets — again and again.
United States
Shoppers in the U.S. may be defined by geographic location, but their buying behavior (and preferences) transcends borders. Driven by a desire for unique products nearly half of the country’s online shoppers bought items from international retailers, according to a 2017 comScore study commissioned by global logistics company UPS. “The lines that separate domestics and international retailers continue to disappear,” UPS Chief Commercial Officer, Alan Gershenhorn, said in a statement. The upshot: Apps are growing in adoption and use in the U.S., but consumers are also buying more from specialty shops and retailers abroad.
Costs & Conversions: Increased Prices for Sure-fire Returns
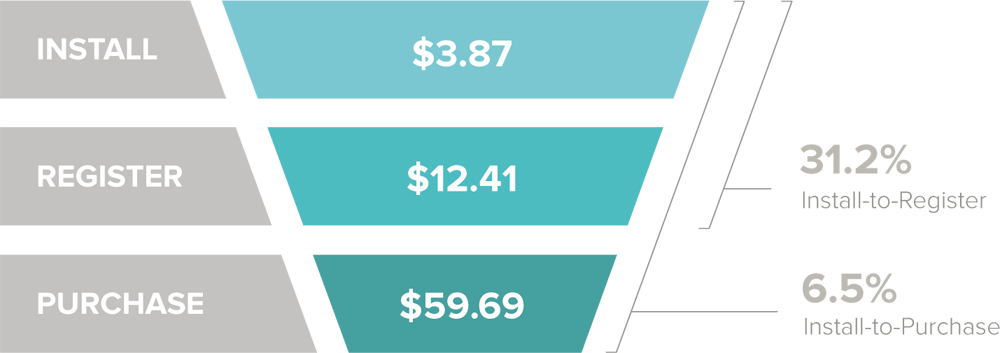
- At $3.87 (compared with $3.78 for the NA region) the cost to acquire a user is in the middle range compared with the other countries in section, but the returns a marketer might expect for this investment are far from average. (Indeed, app store analytics provider App Annie observes that 2018 marked a “turning point” in consumer acceptance of and reliance on shopping apps, resulting in significant growth in time spent in shopping apps and an uptick in digital sales).
- The cost to acquire a user who makes a first purchase ($59.69) is in line with costs for the region, as is the install-to-purchase rate of 6.5% (compared with 6.4% for the region).
USA Shopping Apps Costs & Conversion Rates
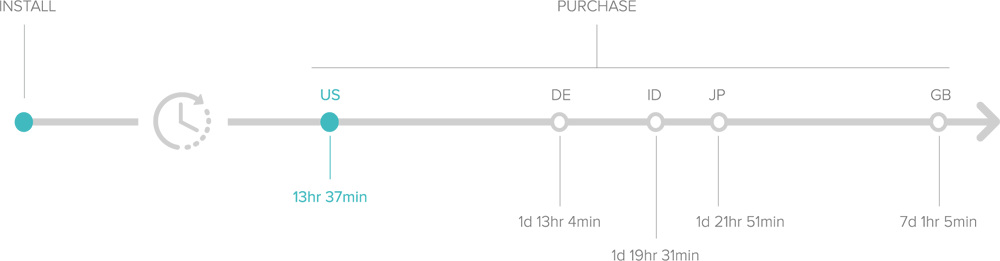
Time to Purchase: Shoppers on Steroids
While U.S. shoppers are not a bargain to acquire, they are a breeze to activate. Clocked at 13 hours and 37 minutes, shoppers in the U.S. are the fastest to make and execute the allimportant decision to purchase. It’s a high speed that indicates high intent, a mindset that may be linked to the low-barrier nature of the activity or the effectiveness of the campaign — or both. The data can’t say for sure.
USA Shopping Apps Time from Install to Purchase
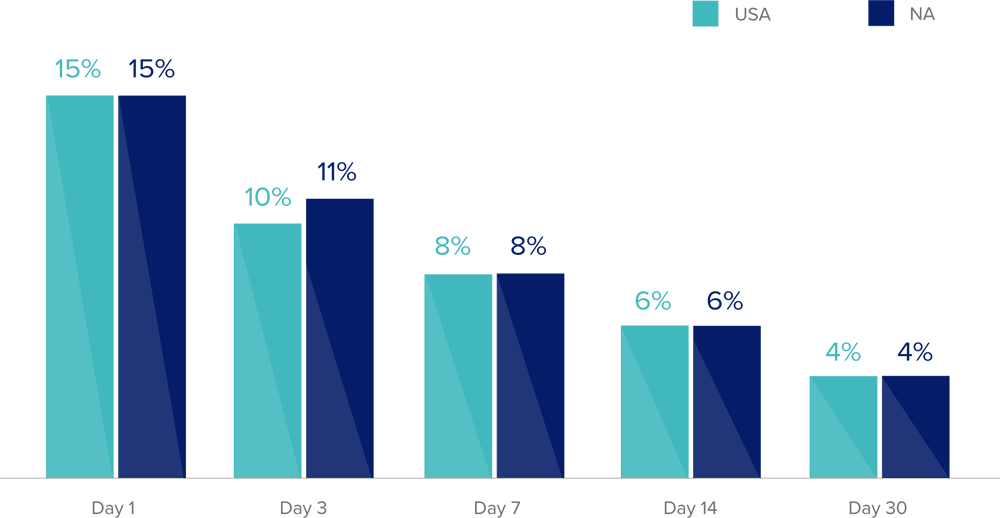
Retention: High Intent But Up Your Game
Overall, retention rates for the U.S. mirror that of the region. It begs the question: would efforts to improve segmentation and engagement, supported by effective campaigns via email, push notifications and other channels, drive longer lasting loyalty? The data can’t say for sure. But in a highly competitive market, it makes business sense for marketers to go the extra mile.
USA Shopping Apps User Retention

Liftoff is a performance-based mobile app marketing and retargeting platform which uses post-install user data to run true cost-per-action user acquisition and re-engagement campaigns. Powered by advanced machine learning and lookalike targeting, Liftoff campaigns are optimized to drive actions beyond the install, like booking a hotel, making a reservation, or renewing a subscription.
Liftoff’s cost-per-action model helps customers scale and grow by acquiring users that actively spend in revenue-producing events. Headquartered in Palo Alto, CA with offices in New York, London, Singapore, Tokyo, and Paris, Liftoff works with leading app publishers and brands across the globe.
![]()
Adjust is the industry leader in mobile measurement and fraud prevention. The globally operating company provides high-quality analytics, measurement and fraud prevention and cyber security solutions for mobile app marketers worldwide, enabling them to make smarter, faster marketing decisions. Adjust is a marketing partner with all major platforms, including Facebook, Google, Snap, Twitter, Line, and Tencent. In total, more than 25,000 apps have implemented Adjust’s solutions to improve their performance. Founded in 2012, today Adjust has global offices in Berlin, New York, San Francisco, São Paulo, Paris, London, Moscow, Istanbul, Tel Aviv, Seoul, Shanghai, Beijing, Tokyo, Mumbai and Singapore.
Adjust recently acquired data aggregation platform Acquired.io and award-winning cybersecurity and AI startup Unbotify. In February 2019, the company formed a strategic partnership with Adways, Japan’s leading mobile marketing agency. These moves are part of Adjust’s goal to unify advertisers’ marketing efforts and build the best-in-class measurement and fraud prevention suite.