Mobile Gaming Apps Report
2019 User Acquisition Trends And Benchmarks
With Retention Data from 
Contents
- Key Takeaways3
- Introduction4
- Mobile Gaming Apps: A World (and Wealth) of Opportunity7
- Global costs & conversion rates7
- iOS vs Android8
- Registration costs & conversion rates by month9
- In-app purchase costs & conversion rates by month10
- Install costs by country11
- Registration costs & engagement rates by country12
- In-app purchase costs & engagement rates by country13
- Retention rates by gaming app category14
- Midcore & Strategy Gaming Apps: A Passion, Not a Pastime16
- Casual Gaming Apps: Feeding our Craving for Snappy Gameplay24
- Hyper Casual Gaming Apps: A New and Dominant Force34
- Social Casino Gaming Apps: Immersive Gameplay with Mass Appeal42
Key Takeaways
- Prepare for a perfect storm of marketing conditions
Moderate increases in costs and impressive double-digit conversion rates indicate that users still need some convincing early in the funnel, but they are willing to pay, play and stay around—particularly if the sub-category offers a habit-forming core loop. - Competition heats up but summer months could give you the edge
A strategy to target users in the summer months from July to September can pay dividends. It’s during this period that the install-to-in-app conversion rate (16.0%) hits its second-highest point and the cost to acquire a new user who makes an in-app purchase hits a low of $27.09. - Don’t just play it safe in mature markets; explore untapped opportunities in APAC and Europe
North America may be a textbook model for robust growth in the mobile gaming apps market, but the data also reveals several countries where potential is huge, but the costs are not. Russia, in particular, stands out as a country that embraces Casual and Social Casino games offering insanely affordable CPIs and eye-watering install-to-registration rates. Japan also merits a closer look, showing the highest interest and commitment to Casual games and a healthy appetite for Hyper Casual. Finally, EMEA—specifically Germany and the U.K.—is a region that offers lower costs and a healthier retention curve for Midcore & Strategy games. - Social Casino has staying power & Hyper Casual has users hooked
Day 1 retention is highest for Social Casino (32.2%) and Hyper Casual (32.7%) games, but it’s Social Casino that maintains momentum into Day 30. But retention rates for three sub-categories (Casual, Hyper Casual and Midcore & Strategy) narrow at Day 7 and again on Day 14, indicating that audiences for these games are equally engaged, and, perhaps, equally receptive to campaigns and messaging that nudge them to return to the game and play more often.
Introduction
Mobile gaming apps continue to grow at a fast and furious pace, set to reach a 60% market share in gaming consumer spend in 2019. But it’s not just the topline numbers that are impressive.
The explosion in Hyper Casual games, which tap a universal desire for simple gameplay, and the expansion of instant gaming platforms from the likes of WeChat and Facebook, are also pushing the pace. The result: a massive market where mobile gaming apps appeal to a much broader audience than ever before.
- Outlook: Mobile gaming will generate revenues of $95.4 billion by 2022, according to Newzoo, a research firm providing market intelligence for games, esports, and mobile.
- Opportunity: A recent study from Newzoo and Activision Blizzard reveals 1 in 2 users have opened a mobile game in the last seven days, making gaming the third most popular app type right behind social media and shopping apps.
- Outcome: We live in the “Golden Age of Gaming,” a time when mobile gaming apps account for 33% of all mobile downloads and 10% of all time spent on mobile, according to app market data provider AppAnnie. It reckons a whopping 74% of all consumer spend on Google Play and Apple iTunes app stores are driven by mobile games.
- The mobile gaming apps market continues to thrive, but that’s no guarantee your business will ride the tide. To keep you (literally) at the top of your game, the 2019 Mobile Gaming Apps Report draws from Liftoff internal data from June 2018 through May 2019. But marketers also need data to drive deep-funnel goals and define retention targets and benchmarks. To this end Liftoff has partnered with AppsFlyer, the global leader in mobile attribution and marketing analytics. AppsFlyer’s analysis of retention data (Day 1, Day 3, Day 7, Day 14 and Day 30), based on 6,500 apps and 950 million installs, is integrated throughout the report.
In this report you’ll find:
 A breakdown of key engagement activities and trends to compare performance across platforms (Android and iOS) and throughout the calendar year.
An analysis of regions (North America, EMEA, APAC and LATAM) highlighting key countries and trends.

Additional granularity on four distinct gaming app sub-categories (Midcore & Strategy, Casual Gaming, Hyper Casual and Social Casino).
![]()
Finally, Liftoff partners with Apptopia—a company that provides app publishers and developers access to app intelligence worldwide to track costs and conversions globally—to give you insights into the total downloads and in-app purchase revenue (for the period June 2018 through May 2019 based on the top 20 iOS games per vertical) generated by each sub-category.
Report Methodology
This report is based on analyzing the following:
- Apps Included
555
- Impressions
107.4B
- Clicks
1.6B
Date Range Analyzed
1 June 2018 – 31 May 2019
- Installs
81.8M
- Registrations
3.8M
- In-App Purchases
14M
Mobile gaming apps: A world (and wealth) of opportunity
Global costs & conversion rates: Rich rewards and high engagement come at a cost
By all counts, the mobile gaming market has never been healthier. However, years marked by an avalanche of apps and new genres has produced users spoilt for choice and somewhat wary of splurging on in-app purchases.
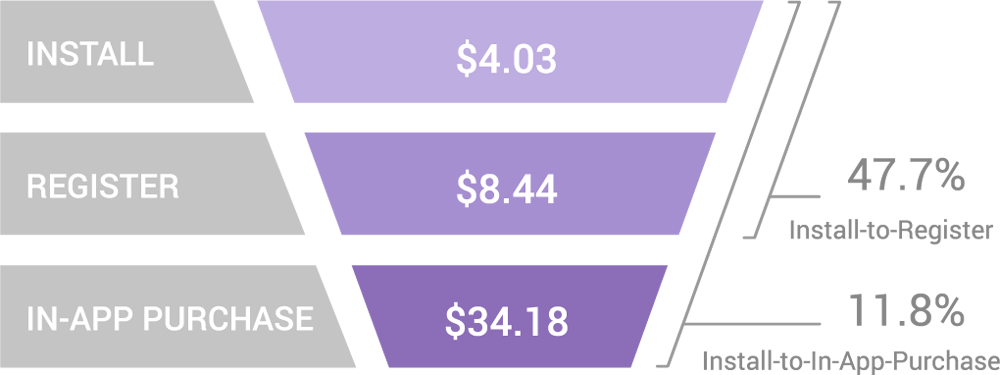
Overall Gaming Apps Costs & Conversion Rates
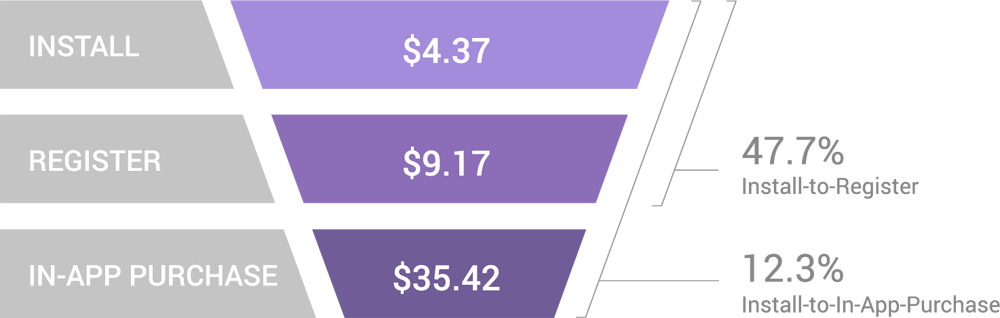
- At the top of the funnel, it costs an average of $4.37 to acquire a new gaming app user, an increase of $0.62 or 16.5% compared to the previous year ($3.75).
- In the middle of the funnel, the cost to acquire a user who completes a registration is pricey at $9.17, up 33.3% compared to the previous year ($6.88). However, the installto-register rate of 47.7% (though down 6.90% compared to the previous year) tells a positive story—provided marketers use the data and analytics collected at this stage to retarget and re-engage users and drive frequent use.
- Deeper in the funnel, the cost to convert a player into a first-time purchaser is hardly a bargain ($35.42). However, a conversion rate of 12.3% (just 1.1% down from the previous year) suggests marketers who strike a chord with their campaigns can still strike it rich.
iOS vs Android: Costs drop, conversions rates dip, and Android remains a better buy
Players are spending tons of money on iOS and Android, but there are trade-offs to make depending on your target market. Android is the one to pick for reach. The platform dominates with about 85% of the total global smartphone market, according to research firm IDC. Meanwhile, iOS continues to generate the most revenue—but recent reports suggest the platform is losing steam and market share in Europe, Japan and China.
Gaming Apps Costs & Conversion Rates by Platform
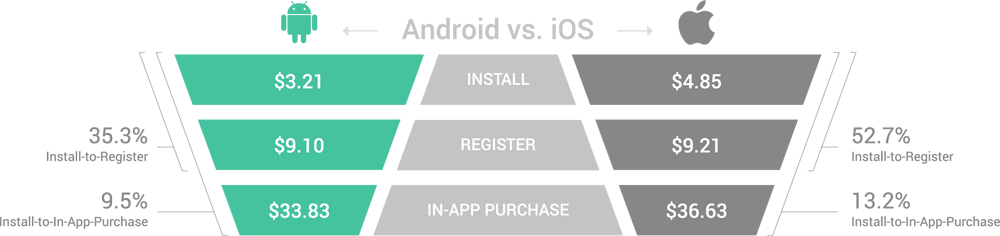
- At $3.21 Android users are a bargain to acquire, compared to iOS users that cost $4.85.
- The cost to acquire an Android user ($33.83) who makes an in-app purchase is up 9.9% over the previous year. This may be in the same range of the cost to acquire an iOS user ($36.63), but a review of the install-to-in-app purchase rate tells a different story.
- Admittedly, the conversion rate for Android users has dipped into the single-digits (9.5%). But the steep decline in rates for iOS users (13.2% from 21.0% the previous year) signals the start of a downward trend that could topple strategies that focus exclusively on winning big-spender iOS users.
Registration costs & conversion rates by month: December and March are banner months
The pay-off for marketers comes when they can buy low and engage high. Fortunately, this is a pattern that marks several key months in the calendar year.
Gaming Apps Registration Costs & Conversion Rates by Month
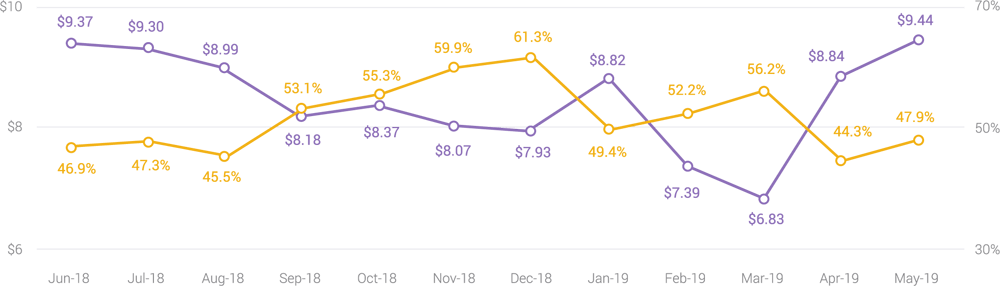
- Engagement rates remain in the double-digits throughout the calendar year, fluctuating between a low of 44.3% in April and a high of 61.3% in December, coincidentally the same month when the cost to acquire a user who will complete a registration dips down to an affordable $7.93 before rocketing by 11.2% to reach $8.82 in January.
- September through December and February through March are periods when a perfect storm of conditions play in favor of strategies to acquire new users. If the aim is to re-engage users you have already acquired, then June through August, the month of January, and the period April through May are the times to target.
- Compared to the previous year, peaks and troughs in the cost and conversion curve have been replaced by a much flatter distribution of values suggesting that seasonality is less of a factor. Users are growing more accustomed to interacting with gaming apps across the calendar year and the window of opportunity is open wider than ever before.
In-app purchase costs & conversion rates by month: Summer is a hot time to capture share of wallet
It pays to target users when they take a break from the routine and dedicate more hours to having fun in the sun.
Gaming Apps In-App Purchase Costs & Conversion Rates by Month
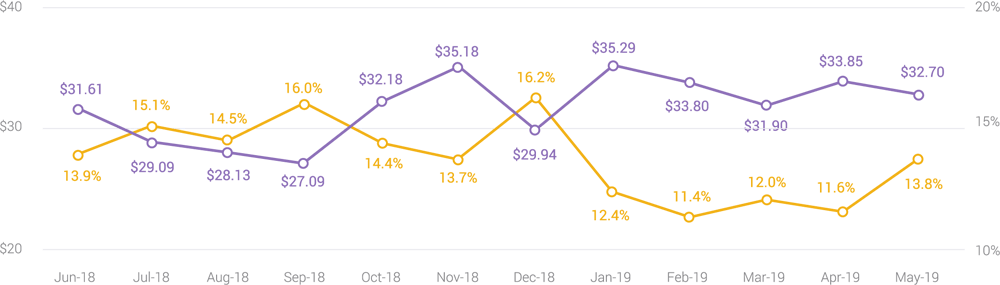
- Costs and conversions are in a rare and positive balance from July to September, when the conversion rate (16.0%) hits its second-highest point and the cost to acquire a user who makes an in-app purchase hits a low of $27.09.
- The holiday buzz may linger into February, but engagement rates languish well into April. December is the stand-out month if you want holiday results that are off the charts, but keep in mind the conversion rate (16.2%) coupled with a price tag of $29.94 is only marginally higher than it is in September.
- Overall, month-over-month costs are comparable with those reported the previous year. However, engagement rates have plateaued at a lower level, indicating marketers have to do more to spark interest and drive conversions.
Install costs by country: Low costs in highly attractive markets
North America may be the starting point for the tremendous growth of the mobile gaming market, but this snapshot highlights several countries where potential is huge, but the costs are not.
Gaming Apps Install Costs by Country
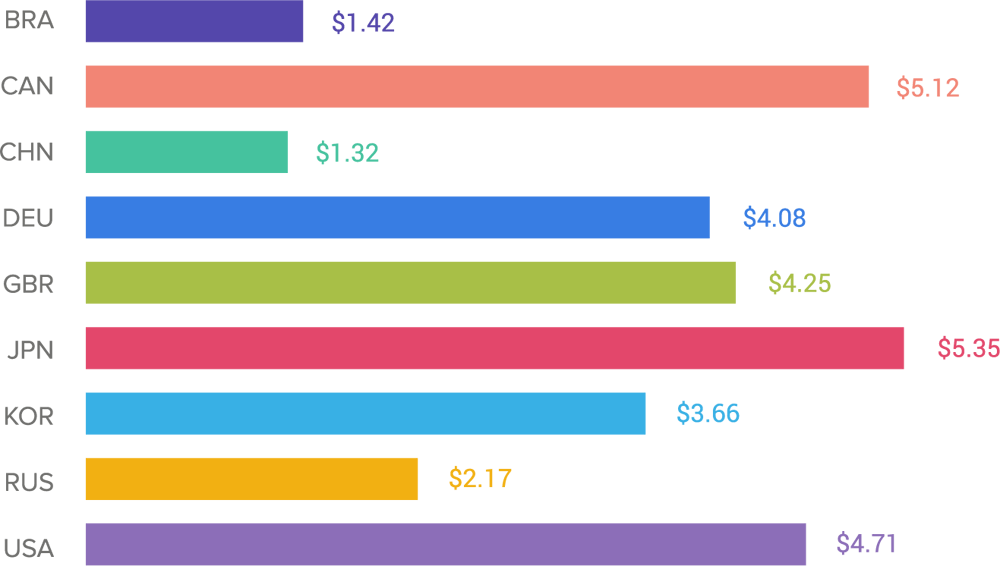
- At $2.17, the cost to acquire a user in Russia sits in the middle for a market that is anything but average. The overall Russian games market, which is home to 66 million gamers, is projected by Newzoo to hit $1.8 billion in revenues.
- China ($1.32) and Brazil ($1.42) offer bargain prices that merit a second look. After all, China, which currently accounts for 25% of the global mobile games market, is punching above its weight with a games-addicted audience expected to reach 728 million by 2023, up from 598 million in 2018. Meanwhile, Brazil offers exponential growth, but the uneven distribution of wealth can make conversion an uphill battle.
- Users in the U.K. (and much of Europe) are developing an enormous passion for mobile gaming apps, a positive trend that suggests prices to acquire installs in these countries (U.K.: $4.25 and Germany: $4.08) are poised to rocket.
Registration costs & engagement rates by country: Russia and Brazil have the clear cost advantage
Gaming Apps Costs & Conversion Rates by Country
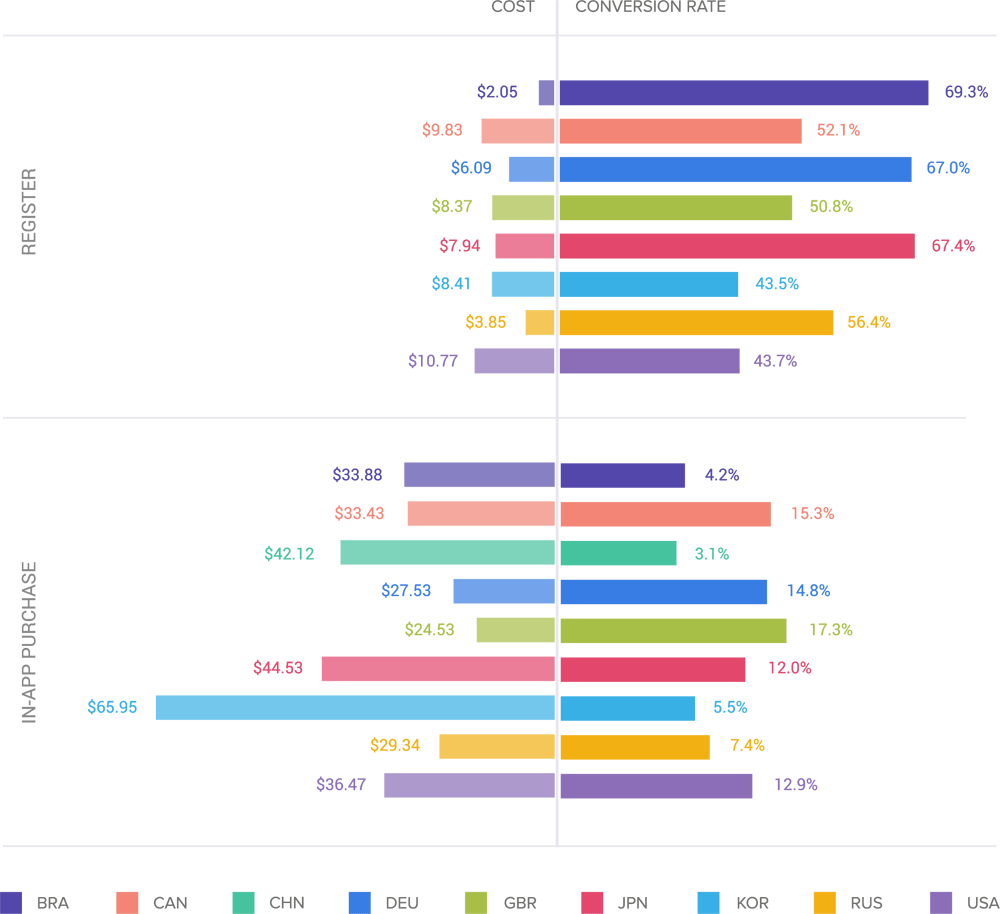
- At $2.05, the cost to acquire a user who will complete a registration in Brazil is over five times less than the cost in the U.S. market ($10.7). What’s more, Brazil boasts a conversion rate of 69.3%, 25.6% greater than the U.S.
- Significantly, Russia is the second cheapest country to acquire a user, and the conversion rate (56.4%) is impressive. It’s also comparable to Canada (52.1%) but offers much better value for money since the cost in Russia ($3.85) is 60.8% lower than in Canada ($9.83).
- Nearly identical conversion rates in Germany (67.0%) and Japan (67.4%), coupled with a $1.85 difference in cost to acquire a user who will complete a registration, may not be a steal, but they do spell opportunity.
In-app purchase costs & engagement rates by country: Germany and the U.K. are willing to play and pay
- Germany, the U.K. and Russia offer comparable costs, but the U.K. offers the lowest cost ($24.53) and the highest engagement (17.3%), a conversion rate that is 9.9% higher than Russia (7.4%).
- When it comes to cost, Brazil ($33.88) and Canada ($33.43) are nearly identical. But that’s where the similarities stop. At 15.3%, the conversion rate in Canada is 3.5x the rate of Brazil (4.2%).
- Predictably, Korea, an incredibly sophisticated market where Midcore & Strategy games enjoy wide appeal, is also the most expensive. High competition for users has driven costs into the stratosphere ($66.95), and the conversion rate of 5.5% suggests marketers risk burning more cash than they generate.
At $24.53, the U.K. offers the lowest cost to acquire a gaming app user that makes a first in-app purchase and the highest engagement rate (17.3%).
Retention rates by gaming app category: Social Casino and Casual Games grab and keep user attention
Each gaming sub-category has its own audience and appeal. Understanding these nuances will help you drive connection with your users and develop campaigns that will extend your customer lifecycle.
Gaming Apps User Retention by Subcategory
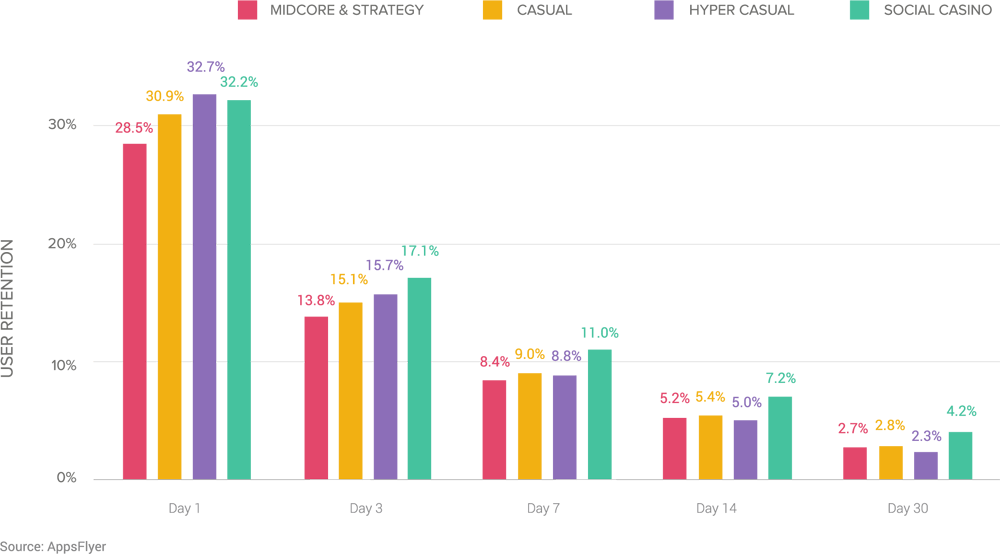
- Social Casino (32.2%) and Hyper Casual (32.7%) gaming apps may rival each other for the top notch spot on Day 1. But Social Casino pulls out ahead by Day 3, a leading position it maintains into Day 30, proving this is a sub-category that greatly benefits from the staying power of the social and competitive elements it combines in gameplay.
- At just 28.5%, Midcore & Strategy may seem to get off to a slow start on Day 1, but it picks up speed. A milestone to note is Day 14, when the retention rate (5.2%) nearly ties with that of Casual games (5.4%) to take third place.
- Significantly, the gap in retention rates for Casual, Hyper Casual, and Midcore & Strategy narrow at Day 7 and again on Day 14, indicating that audiences are equally engaged and perhaps equally receptive to campaigns and messaging that reinforce the value proposition of the games that attracted these players in the first place.
With the highest retention rate on Day 30, Social Casino greatly benefits from the staying power of the social and competitive elements it combines in gameplay.
Midcore
& Strategy
This category, which includes role-playing games (RPGs) and adventure games, distills hardcore games down to their essence, delivering users a more lighthearted and immersive experience. Shorter sessions empower the 30-somethings who make up the majority of the audience to fit gameplay around their daily schedule, and not the other way around.
EXAMPLES:
Empires & Allies, War Machines: 3D Tank Games, War Robots, Vikings: War of Clans, Narcos: Cartel Wars and Game of Thrones: Conquest.
Midcore & Strategy Gaming Apps:
A passion, not a pastime
Positioned at the intersection of immersive experience and casual gameplay, this sub-category appeals to an audience that is both eager to play and willing to pay.
Midcore & Strategy Gaming Apps Costs & Conversion Rates
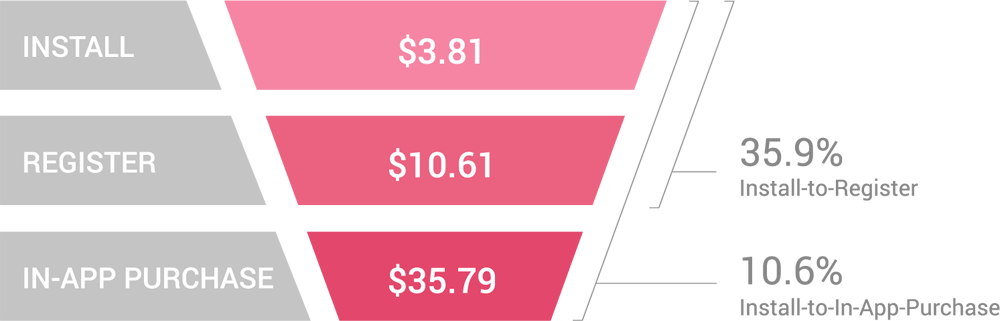
- Competition for Midcore & Strategy gamers is heating up, but CPIs are keeping cool at a comfortable $3.81.
- At $35.79, the price tag for a user who makes an in-app purchase may seem pricey, but this is balanced by a double-digit conversion rate that speaks volumes.
- Overall, users aren’t an easy sell, but they don’t balk at spending time and money to master the addictive gameplay.
![]()
Apptopia data pegs worldwide downloads of Midcore & Strategy apps at 192,022,661, generating $5,644,667,096 in in-app purchase revenue.
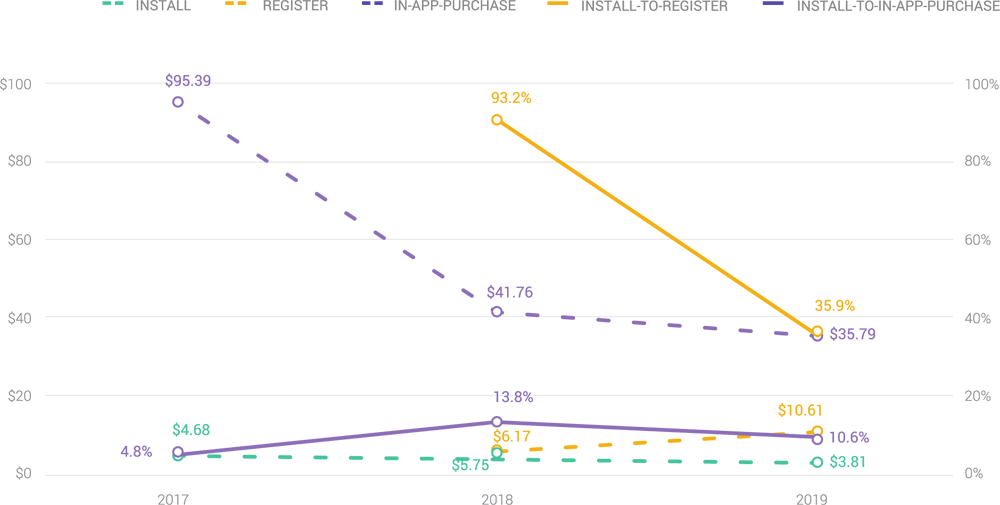
In-App purchase costs show a positive trend YoY
- Costs are decreasing, and conversion rates are stable deep in the funnel, where it counts the most.
- Install-to-in-app purchase costs are down by a factor of over 2.5 from $95.39 in 2017 to $35.79 in this year’s report. Registration, where costs ratcheted up 72.0% to reach $10.61, appears to be the biggest hurdle.
- Install-to-in-app purchase conversion rates dipped 3.2 percentage points to reach 10.6%, compared to 13.8% the previous year.
Midcore & Strategy Gaming Apps Costs & Conversion Rates YoY
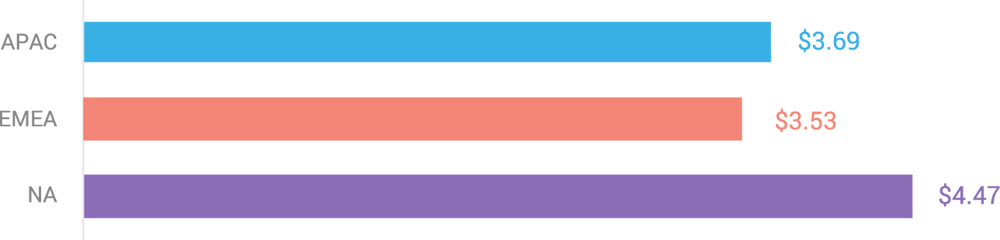
Install costs converge, but EMEA may be the ‘next opportunity’
At $3.53 CPIs in EMEA offer value for money, coming in 4.3% under APAC ($3.69) and a whopping 21.0% under North America ($4.47).
Midcore & Strategy Gaming Apps Install Costs by Region
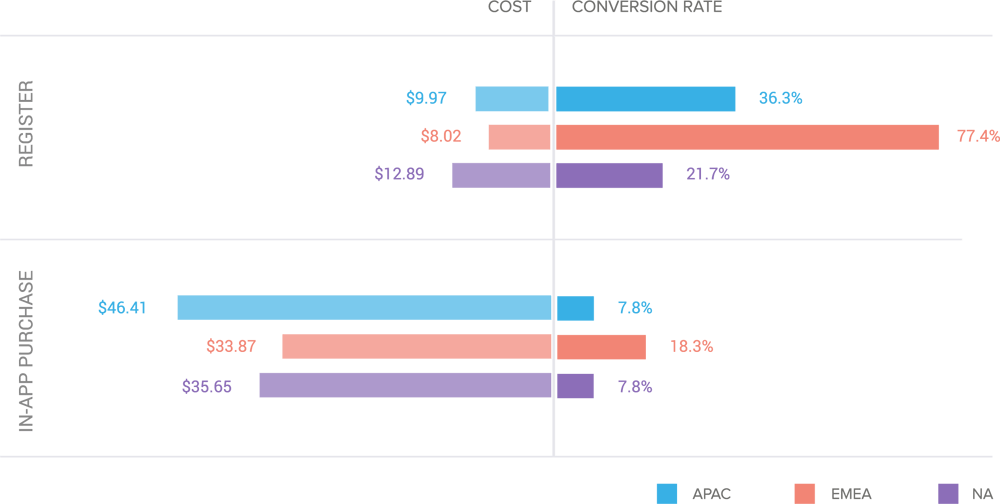
Big fans in APAC, but the action is in EMEA
- At $8.02, EMEA takes the lead with both the lowest cost to register and the highest install-to-register conversion rate (77.4%). The difference in cost with the second place runner APAC ($9.97) is $1.95 or 19.6% less. But don’t let the bargain blind you. EMEA towers with a conversion rate that is more than 2X that of the APAC region.
- Deeper in the funnel, EMEA also offers better value for money. At $33.87, the cost to acquire a user who completes an in-app purchase may not be a steal. But it is nonetheless 27.0% lower than APAC ($46.41) and a conversion rate 10.5% higher than both the APAC and North America ensures high returns, not losses.
Midcore & Strategy Gaming Apps Register & Purchase Costs & Conversion by Region
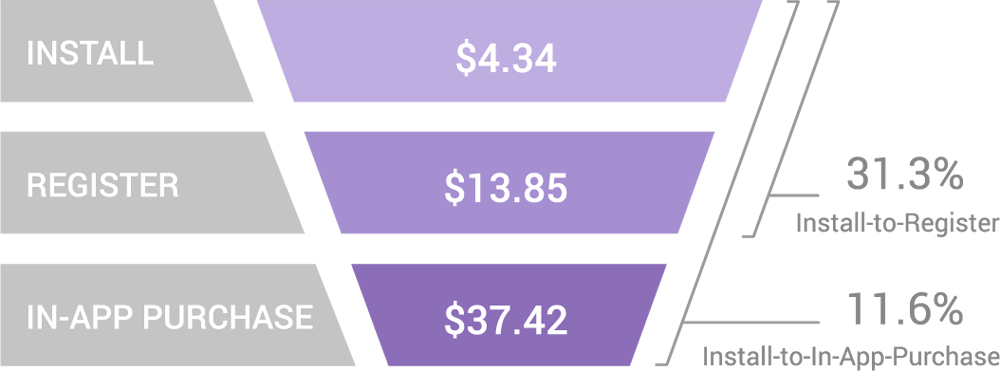
U.S. deep-dive
- Install costs are a steal in the U.S. at $4.34, 2.9% less than the North America region ($4.47). However, the cost to acquire a user who completes a registration ($13.85) is pricey — coming in 7.5% higher than the cost for North America ($12.89).
- Compared to the rest of North America, the cost to acquire a user who makes an in-app purchase is slightly higher than the region, but this is balanced by higher conversion rates.
- Conversion rates are attractive and the install-to-in-app-purchase (11.6%) is 48.7% greater than the rate for the region (7.8%).
USA Midcore & Strategy Gaming Apps Costs & Conversion Rates
![]()
Apptopia data pegs downloads of Midcore & Strategy apps in the U.S. at 43,200,415, generating $493,052,301 in in-app purchase revenue.

Retention slides, but gradual stages offer chances to re-engage
Midcore & Strategy Gaming Apps User Retention
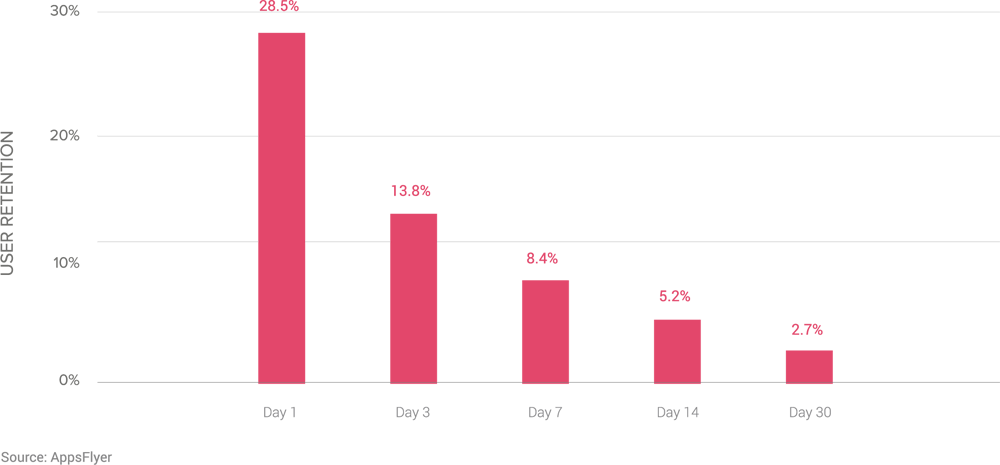
- At 28.5%, Day 1 retention is what you would expect for a gaming sub-category that demands attention and buy-in from the start.
- Retention naturally tapers off over time, but it doesn’t fall off a cliff.
- The decrease in retention rates between Days 3, 7 and 14 (hovering around the 8.6% range) suggests well-timed campaigns with well-thought out messaging might easily reignite interest in returning to the game.
Install costs are a steal in the U.S. at $4.34, 2.9% less than the North America region ($4.47).
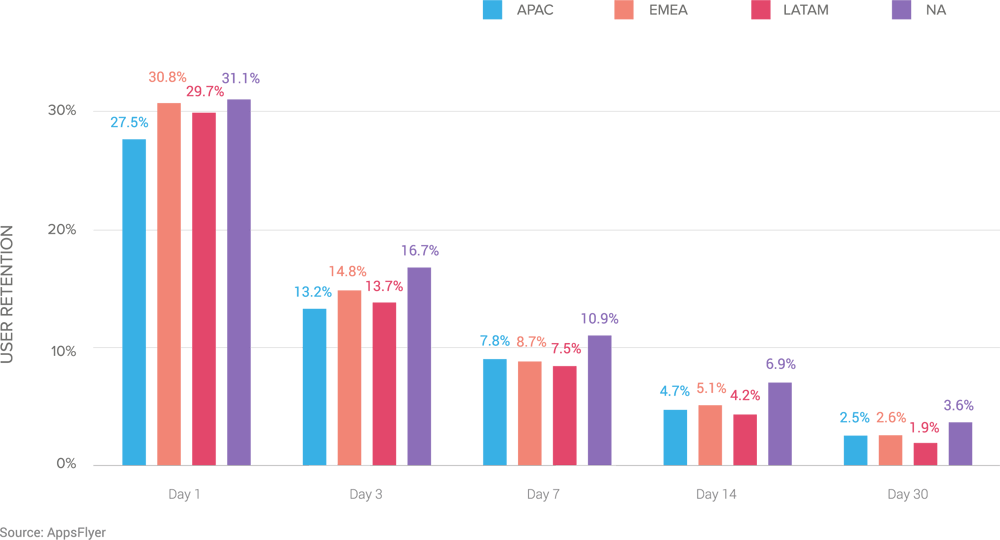
Audiences in EMEA and North America play for keeps
- Retention rates across all regions are strong from the start, but North America and EMEA show staying power with retention rates at each stage that are those few decisive percentage points ahead of the rest.
- APAC is also home to loyal users, but a holistic view of this region shows attractive retention rates are overshadowed by relatively high acquisition costs and lack-luster conversion rates.
Midcore & Strategy Gaming Apps User Retention by Region
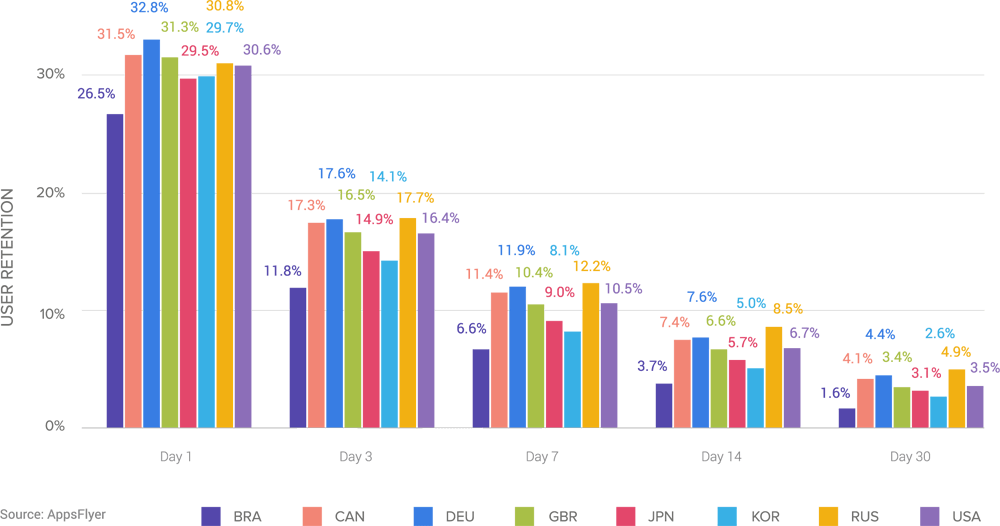
EMEA and Japan: Home to ‘hardcore’ Midcore gamers
- At 32.8%, Germany leads the pack on Day 1, with U.K. (31.8%) a close second. Japan also impresses with a 20.8% retention rate. It’s a combination that leads the group from Day 3 to Day 30 retention.
- Japan’s deep and lasting loyalty is aligned with what Newzoo calls the country’s “strong affinity” with many Midcore franchises, such as Final Fantasy, which were developed in Japan.
- Significantly, Brazil, a country that offers extraordinary value for money, is marked by retention rates that underwhelm at every stage.
Midcore & Strategy Gaming Apps User Retention by Country
Casual
Casual games, which includes bubble shooters, match 3 games, word games, hidden object games, and puzzle games, offers a core game loop that keeps users riveted for months, not hours. As a rule, games do not require a significant time investment to play, win and enjoy—and this high level of playability spurs spontaneous and frequent gameplay.
EXAMPLES:
Trivia Crack, Gardenscapes, Magic Jigsaw Puzzles, Seekers Notes and Bubble Birds.
Casual Gaming Apps: Feeding our craving for snappy gameplay
From brain teasers and puzzles to arcade and simulation games, Casual gaming apps have already generated huge revenues. This is because players are quick to learn and easily hooked.
Casual Gaming Apps Costs & Conversion Rates
Puzzle games alone accounted for $3.8 billion in sales in 2018, up 34.0% from the previous year. But the biggest winner may be arcade games, which netted $1.9 billion in 2018, nearly double the year before.
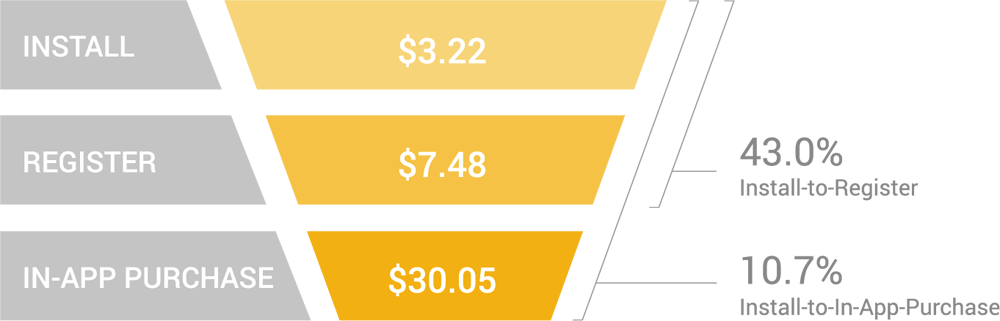
- Players are attractively priced and easy to move through the funnel.
- Registration, often the most difficult stage, is a breeze, and the 43.0% install-to-register rate is a bonus.
- At $30.05 the cost to acquire a user who will complete an in-app purchase is not a bargain, but the double-digit conversion rate is positive—as is the overall receptiveness of this audience to rewards, incentives and advertising to continue gameplay.
![]()
Apptopia data pegs worldwide downloads of Casual gaming apps at 249,448,679, generating $3,046,390,877 in in-app purchase revenue.
A maturing market in need of a refresh?
Casual Gaming Apps Costs & Conversion Rates YoY
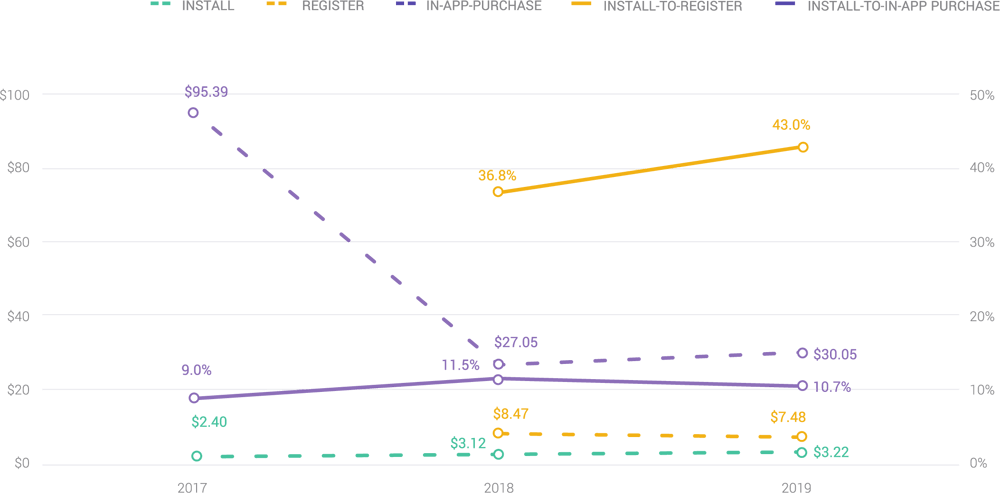
- Costs and conversions paint a mixed picture. Install costs are holding steady, rising by only $0.10 or 3.2% from the previous year to reach $3.22.
- Significantly, the stigma attached to registration is absent in this sub-category. At $7.48, the cost to acquire a user who completes a registration is 11.7% less than the previous year. Meanwhile, the install-to-register rate has rocketed by 16.9% to reach 43%.
- Unfortunately, players aren’t lining up to open up their wallets. In-app purchase costs have increased 11.1% to hit $30.05. But this is somewhat balanced by conversion rates for this activity that have dipped by just 7.0% to stabilize at 10.7%.
APAC: higher CPIs but perhaps well worth the price tag
Casual Gaming Apps Install Costs by Region
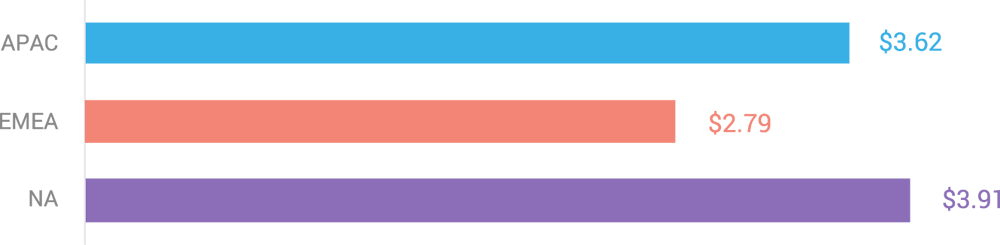
- At $2.79, CPIs in EMEA are unquestionably the cheapest, but do they offer value for money? Research shows APAC is united in its love for Casual games, which consistently rank among the most downloaded games across the region.
- North America is another region where Casual games have found a large and loyal audience. This is reflected in the CPIs, which are the most expensive (8.0% more than APAC and 40.1% greater than EMEA
Casual Gaming Apps Register & Purchase Costs & Conversion by Region
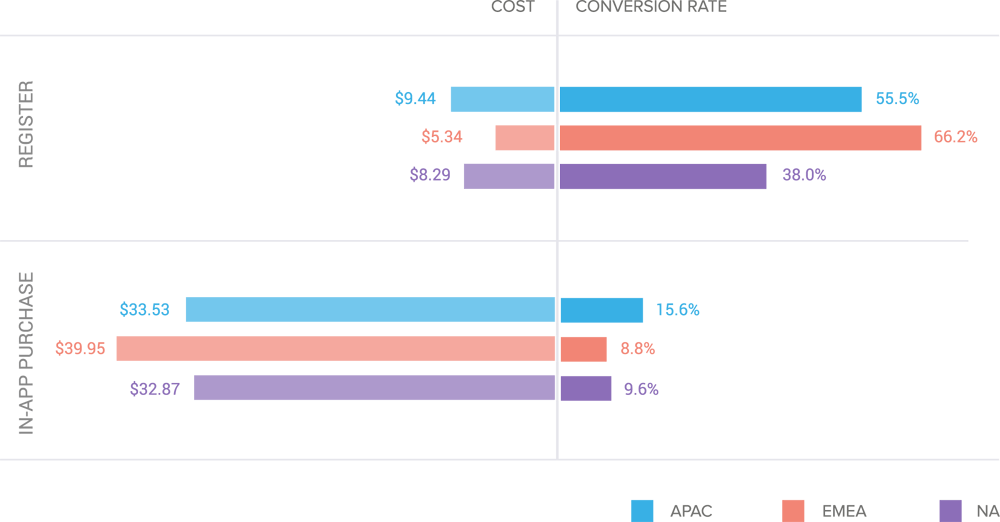
- With the lowest cost ($5.34) and the highest conversion rate (66.2%), users in EMEA appear to be the most enthusiastic. But deeper in the funnel, the victory of acquiring users in EMEA may be an empty one as the conversion rate (8.8%) is the lowest in the group.
- Unsurprisingly, APAC, home to the most active and loyal Casual gamers, is characterized by expensive costs early in the funnel (where competition for audience has a knock-on effect on price).
- However, the highest engagement rates for in-app purchases (15.6%) for marginally more than the cost in North America ($32.87) and 16.1% less than in EMEA ($39.95) make the upfront investment worthwhile.
APAC, home to the most active and loyal Casual gamers, is characterized by expensive costs early in the funnel (where competition for audience has a knock-on effect on price).
Japan deep-dive
Japan offers the highest conversion rates compared to Korea, Russia and the U.S. But at $5.35 it also carries the highest price tag—nearly 1.6x that of Korea and and 5x that of Russia.
Japan Casual Gaming Apps Costs
& Conversion Rates
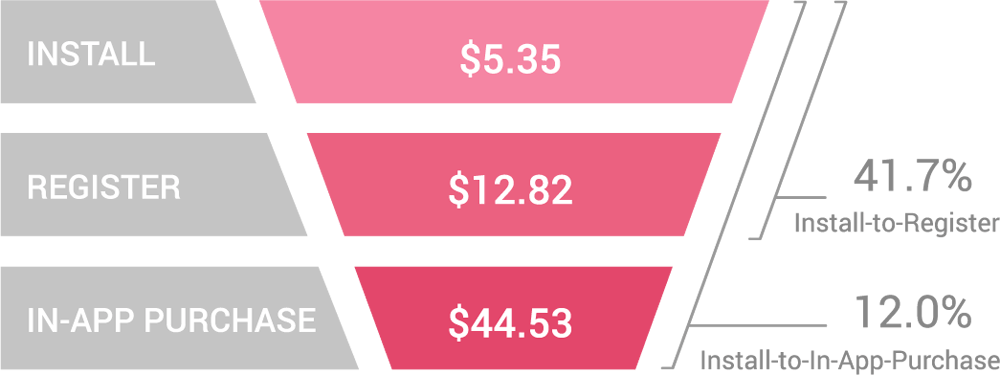
![]()
Overall, Apptopia data pegs downloads of Casual games in Japan at 18,003,649, generating $944,572,705 in in-app purchase revenue.
Korea deep-dive
Korea is a tough nut to crack. The lure of moderate CPIs ($3.36) is overshadowed by the significant cost to acquire a user who will make an in-app purchase ($65.95), nearly 2x the cost in both the U.S. ($34.18) and Russia ($34.19). A conversion rate in the low singledigits (5.1%) is a sure-fire sign that this is a mature market that will test your mettle.
Korea Casual Gaming Apps Costs
& Conversion Rates
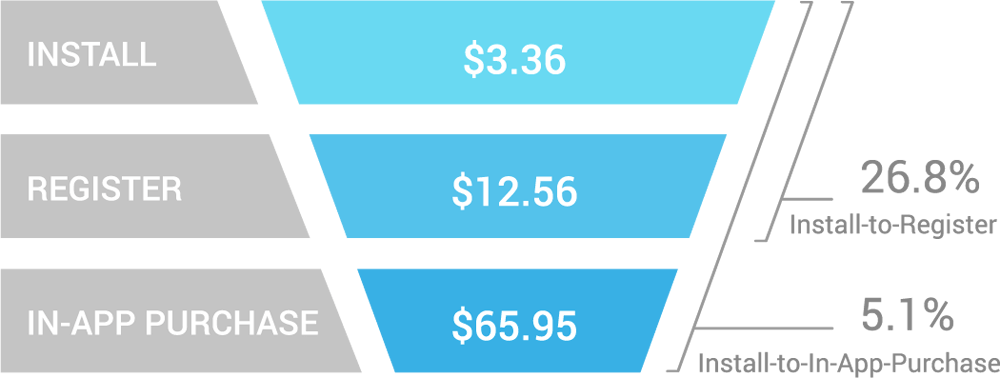
![]()
Overall, Apptopia data pegs downloads of Casual gaming apps in Korea at 78,190,044, generating $1,106,690,974 in in-app purchase revenue.
Russia deep-dive
Russia has the lowest CPI, coming in at $1.09 (73.0% less than the U.S. and 79.6% less than Japan). Unfortunately, the dazzle of the insanely high install-toregister rate of 89.5% is overshadowed by a 3.2% install-to-in-app purchase rate, the lowest in the group.
Russia Casual Gaming App Costs
& Conversion Rates
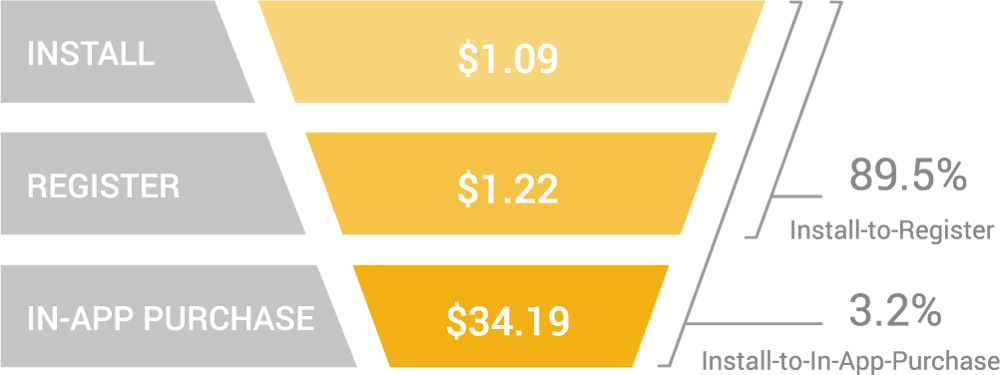
![]()
Overall, Apptopia data pegs downloads of Casual gaming apps in Russia at 8,512,406, generating $16,155,444 in in-app purchase revenue.
U.S. deep-dive
The U.S. is a market that mirrors Japan in many ways at many stages in the funnel. Conversion rates may be just a few percentage points apart, but the U.S. also offers bargain prices, including a cost to acquire a user who will complete an in-app purchase ($34.18) that is that 23.2% under Japan ($44.53).
USA Casual Gaming Apps Costs
& Conversion Rates
![]()
Overall, Apptopia data pegs downloads of Casual gaming apps in the U.S. at 78,190,044, generating $1,106,690,974 in in-app purchase revenue.
Casual games have lingering appeal
Casual Gaming Apps User Retention
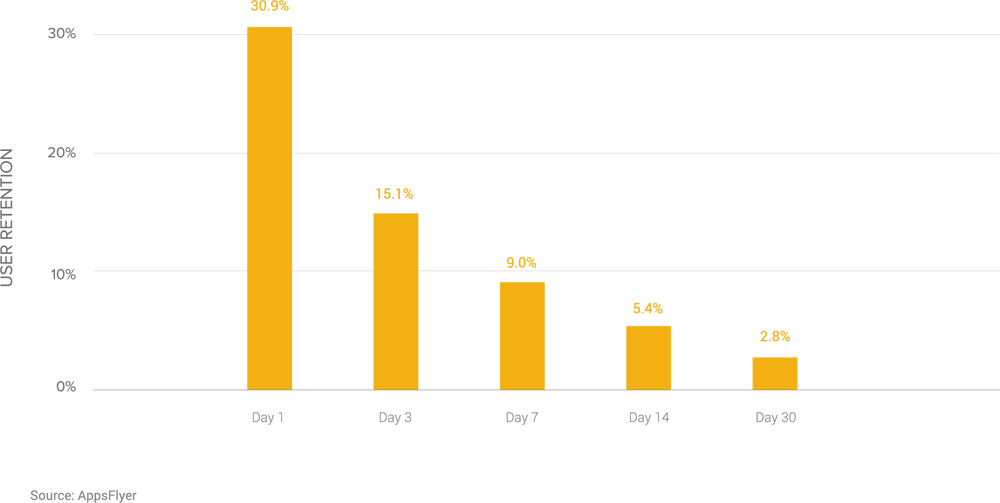
- Retention rates hit a respectable level on Day 1 (30.9%), not surprising for an addictive sub-category that continually grabs and keeps user interest.
- At 15.1%, the retention rate on Day 3 has dropped by roughly 50%, marking a critical date when marketers are well-advised to intervene and reinvigorate interest in gameplay with smart campaigns and attractive incentives.
- Overall, retention tapers off in measured steps, dropping by 6.1 percentage points from Day 3 to day 7 and roughly half of that again (3.6) on Day 14. This curve leaves ample room for marketers to test and prove (or disprove) the effectiveness of approaches to identify and inspire audiences to re-engage.
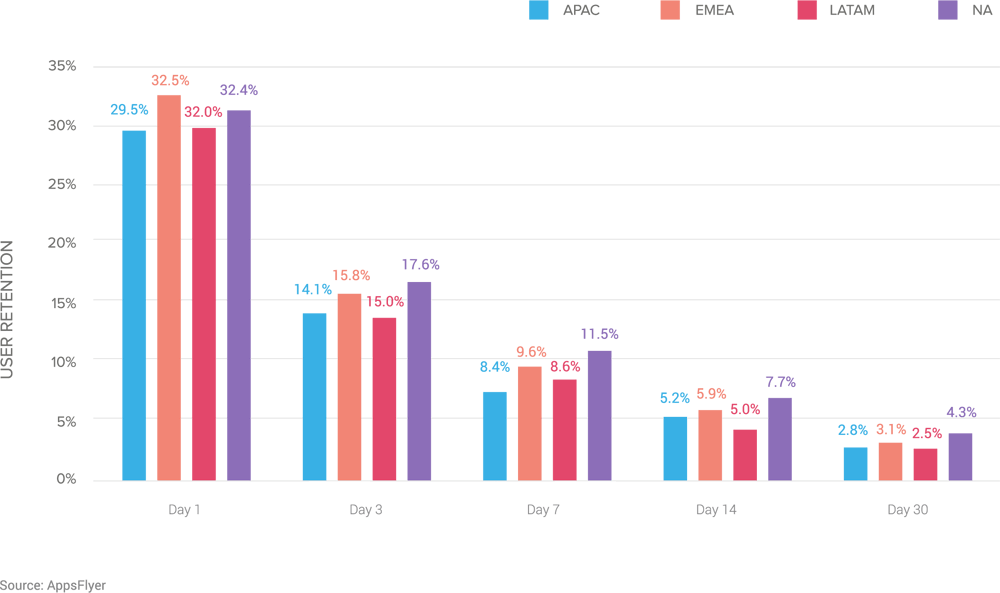
North America can’t get enough of Casual gaming apps
- While retention rates across all regions get off to a solid start on Day 1, retention at all the stages that follow hits its highest marks in North America.
- From Day 3 onward, EMEA comes in a close second, reporting retention rates that trail the U.S by an average of 1.7%. However, a more holistic view of Liftoff data for this region suggests efforts to drive retention may not pay high dividends as players are also quite hesitant to make in-app purchases.
- Significantly, APAC and LATAM start on Day 1 with retention rates that are just 2 percentage points apart, a pattern that continues through to Day 30.
Casual Gaming Apps User Retention by Region
Japan shows the highest commitment to Casual games
Casual Gaming Apps User Retention by Region
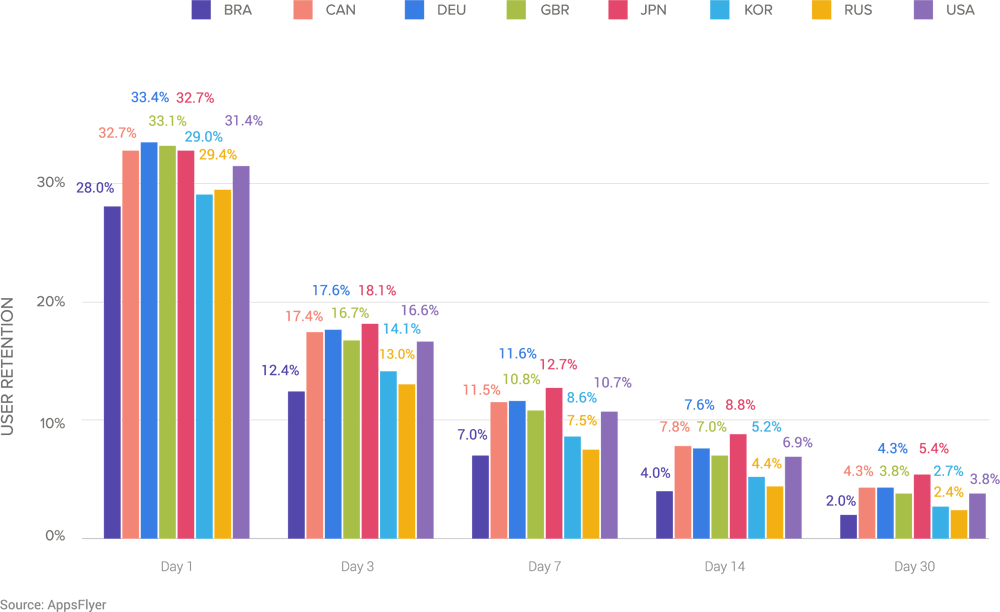
- The retention curve for Japan is characterized by consistently higher retention rates at every stage, culminating on Day 30 with a 5.4% retention rate (25.6% higher than Germany and Canada, which tie for second place at 4.3%).
- Significantly, Brazil stands out as a country that quickly loses interest in Casual games. The country consistently places last at every stage, and only 2.0% of users are retained by Day 30.
- The U.S. and Canada both have healthy appetites for Casual games. However, Canada pulls slightly ahead of the U.S. by Day 30–the stage where the U.S. ties with U.K. for third place (3.8%).
Hyper
Casual
Hyper Casual games include a new breed of lightweight games that are instantly playable and infinitely replayable, supported for the most part by advertising. The combination of simple game mechanics and minimalistic design ensures a “tap-to-play” experience that is highly engaging. However, healthy long-term retention curves are the exception, not the rule.
EXAMPLES:
Stack Ball, Run Race 3D, Traffic Run, Color Bump 3D, Clean Road and Love Balls.
Hyper Casual Gaming Apps: A new and dominant force
Hyper Casual games are the biggest growth story in mobile gaming.
These games—which mostly monetize through advertising—captured more than half of all gaming app downloads and saw several exits since 2017 bring in eye-watering amounts of cash. In a short span of time Ubisoft acquired Ketchapp, a company whose portfolio is said to have netted 23 million new users every month. Not to be outdone, Zynga acquired Gram Games for $250 million in 2018. Sensing an unbeatable business opportunity in Hyper Casual games Goldman Sachs invested $200 million in Voodoo the same year.
The influx of so much cash will go a long way toward keeping the supply of Hyper Casual games high—but chances are competition will also increase as the space becomes much more crowded and challenging. But there is an upside: the focus on ad-supported models and monetization mean profit and scale go hand-in-hand. In fact, research into the broad appeal of this sub-category reveals that Hyper Casual gaming app users, on average, view 4.8 video ads, 2x more video ads, compared to users playing games in other categories.
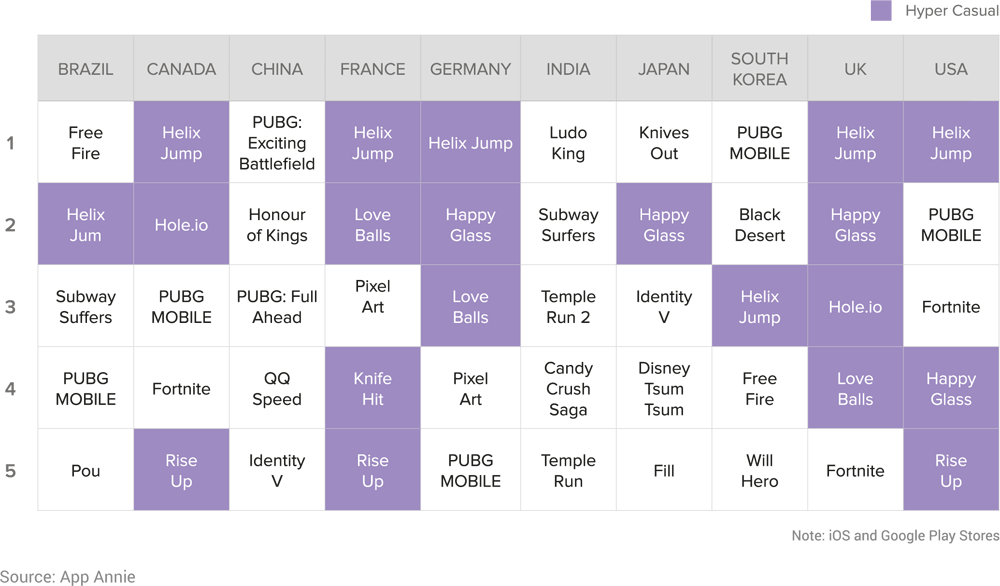
More importantly, Hyper Casual titles are creating new audiences, not cannibalizing existing ones. Globally, app market data provider App Annie observes, the appeal of Hyper Casual gaming has “expanded to those who don’t necessarily self-identify as gamers.” App Annie’s review of top ranking games, which shows Hyper Casual games dominate downloads across a range of markets, underlines the staying power and potential of this sub-category.
![]()
Apptopia data pegs worldwide downloads of Hyper Casual gaming apps at 627,893,873, generating $53,241,653 in in-app purchase revenue.
Hyper Casual Games Take-off, Broadening Market
App Annie observes that the Hyper Casual gaming apps category has grown rapidly. This signals an “emerging opportunity for publishers who want to produce low cost, snackable games to monetize through digital advertising.”
Hyper Casual has room to grow
An analysis of Hyper Casual games and game mechanics reveals several factors guarantee their continued success.
- Hyper Casual games thrive on minimal design, which makes them easy to produce and simple to localize.
- They sharply focus on offering “mindless entertainment,” bypassing efforts and spend to onboard users or train them with tutorials.
- Soft launches aren’t limited to English-speaking countries, and playability (and popularity) is global from the get-go.
This explains what has allowed Hyper Casual games to become the most profitable subcategory in the app stores. But which markets promise the powerful combination of high user interest and low CPIs?
A recent study by Tenjin, a company that provides tools allowing marketers to analyze the source, advertising revenue, cost, and ROI of their users, highlights several countries where conditions are favorable. In fact, it found that CPIs can be more than 10x cheaper than other game genres.
Android and iOS Average CPI by Country
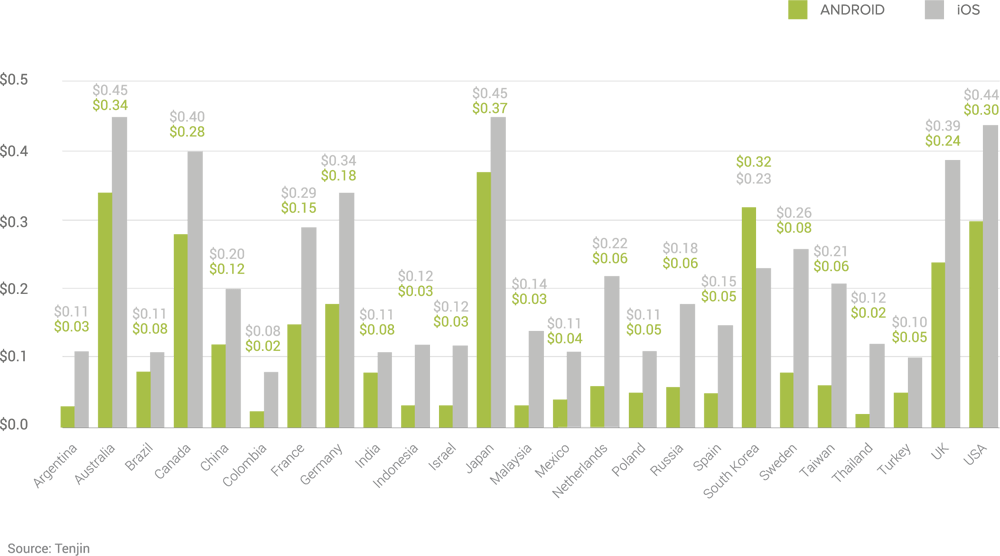
The Tenjin report, which focuses on identifying the most cost effective markets for soft launch, breaks down CPI data by platform to conclude that Columbia is the winner on both platforms. Argentina, Malaysia, Israel and Indonesia offer similar CPIs. On iOS, it’s a different mix, with Turkey offering the second lowest CPIs, beating out a long list of countries including Brazil, Russia, the U.S. and Japan.
Retention starts high—but can marketers raise the bar?
Hyper Casual Gaming Apps User Retention

- At 32.7%, the Day 1 retention is the highest of all sub-categories, as it should be. In fact, some industry insiders claim a Hyper Casual game is first considered successful if Day 1 retention hits 40%.
- The lifetime of Hyper Casual games is short by design, and the majority of returns comes from ads. Therefore, audiences don’t need to stick around for long. Against this backdrop, the steep decline from Day 7 is par for the course, not a cause for concern.
The goal of any marketer is to get the most out of audiences and encourage lasting loyalty. However, this can be a tall order in a sub-category where titles come and go like mayflies. As Shani Rosenfelder, Head of Content & Mobile Insights at AppsFlyer, observes: “Hyper Casual games suffer from low retention rates, which is no surprise considering these games offer users a ‘pick-up-and-play’ flow, a short game loop and no strings attached.”
For this reason, users tend to abandon a game after several days, and quickly move to the next game. “It therefore makes sense for marketers to aim for a short ROAS window, spending massively on UA and aggressively monetizing users with different ad placements,” Rosenfelder explains. “It’s a strategy that has proven itself.”
Significantly, Rosenfelder points out, any improvement in the retention rate (even just extending the average lifetime of a user by a day or two) “would immediately boost their cash flow, increasing ad views and further feeding the positive UA-ad monetization cycle.” Specifically, compelling campaigns or messaging delivered on Day 7 (when retention starts its dive from 8.8% to a mere 2.3% on Day 30), supported by a product that builds on game mechanics to deepen trigger user interest, would yield positive results.
North America hits high engagement with Hyper Casual games
Hyper Casual Gaming Apps User Retention by Region
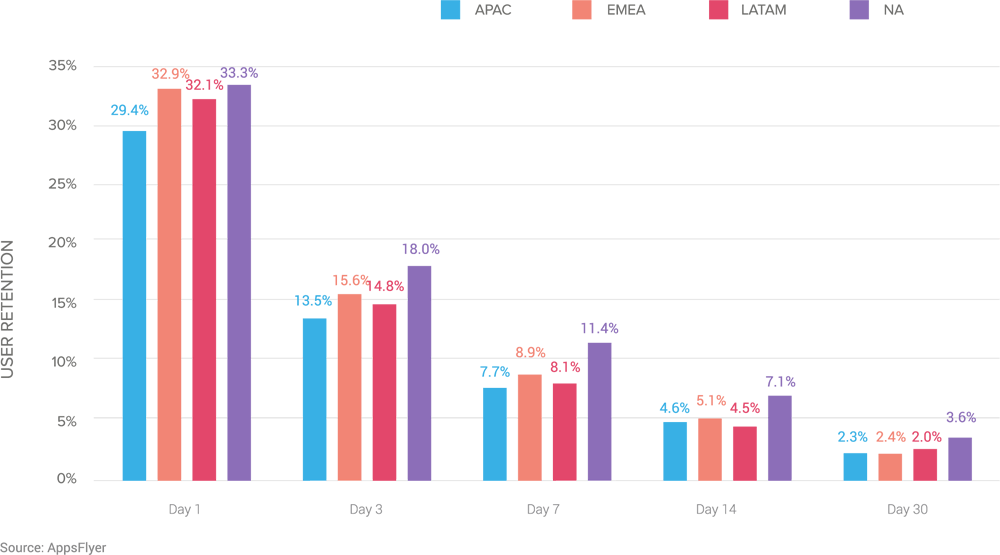
- Retention rates in North America consistently come in at the high-end, providing market conditions that are essential for success.
- EMEA is a close second, kicking off on Day 1 with a retention rate of 32.9% (just 1.2% under North America and 2.5% ahead of LATAM, another region highly receptive to Hyper Casual).
- Retention rates in APAC finish last at every stage, plummeting by nearly 75% from Day 1 to Day 7 and a further 10% by Day 14.
Hyper Casual has users in Japan and the U.S. hooked
Hyper Casual Gaming Apps User Retention by Country
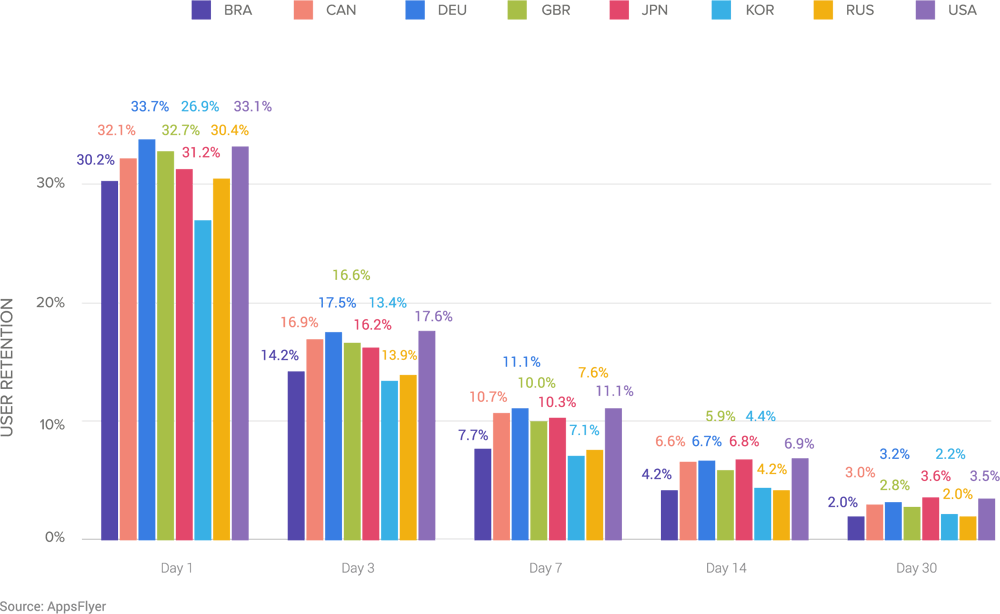
- Users in Japan and the U.S. are highly engaged at every stage, even on Day 30 when interest in other countries has cooled.
- Germany ties with the U.S. at most stages, and then dips below the U.S. by 8.6% to hit 3.2% (compared to the U.S. with 3.5%).
- Korean users are hard to keep, even on Day 1, when retention is trailing the U.S. and Japan by an average of 16.3%. Critically, retention plummets by half from Day 1 to Day 3 to reach 13.4% before declining by another 83.6% to hit 2.2% on Day 30.

Users in Japan and the U.S. are highly engaged at every stage, even on Day 30 when interest in other countries has cooled.
Social
Casino
Social Casino games, including slots, video poker, keno, bingo and blackjack, combine competitive and social elements to attract a broad demographic. The average player is more of a gamer than a gambler—and the majority of games do not require real-money to play. In general, winning (real or virtual currency) is not the thrill, and players frequently engage to have a good time in a relaxed environment without fearing what they might lose.
EXAMPLES:
DoubleDown Casino, Jackpot Casino, Game of Thrones Slots Casino, Fairway Solitaire and Jackpot Poker by PokerStars.
Social Casino Gaming Apps: Immersive gameplay with mass appeal
Social Casino games are soaring in popularity thanks to a simple concept that taps into the universal desire of users to connect, compete and have fun.
The clever combination of social and competitive elements ensures users don’t just play the game—they return often drawn by attractive rewards, low-risk gameplay and the potential to make new friends. Latest reports estimate the overall social game revenue at $1.27 billion in just the first three months of 2018, an 18% improvement over the same period the previous year fueled primarily by users playing on mobile devices.
Little wonder this sub-category has high returns and impressive loyalty. “Social Casino marketers have become experts at driving users back to their app over time and maximizing monetization potential in the process,” AppsFlyer’s Rosenfelder observes. As a result, he says, the Social Casino game economy has been almost entirely focused on in-app purchases to get the most mileage out of users. “But recently we’ve seen the rapid advance of in-app advertising and events aimed to blend advertising into the gameplay in order to monetize non-paying users, the segment that make up the vast majority of users.”
It’s a smart approach that Rosenfelder says ensures that users who might previously have ceased playing a game when confronted by an in-app purchase offer now have an option that encourages them to stay in the game. “Users can engage with rewarded video ads, interaction that allow them to continue playing without spending a dime.” Moreover, marketers who pursue this monetization strategy also benefit from higher retention rates provided their campaigns are matched by the proper user segmentation strategy.
![]()
Apptopia data pegs worldwide downloads of Social Casino gaming apps at 40,315,966, generating $686,009,826 in in-app purchase revenue.
Social Casino Gaming Apps Costs & Conversion Rates
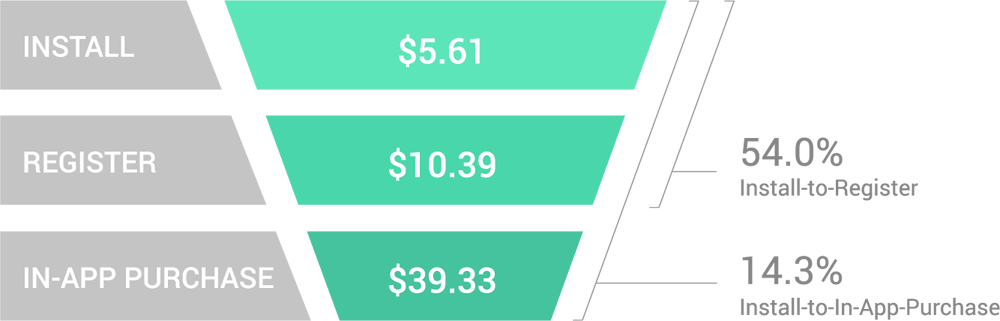
- At $5.61, the CPI is the highest among all sub-categories in this report and 28.4% more than the CPI for gaming apps overall ($4.37). This is no doubt linked to the staggering popularity of the sub-category and the tough competition for users.
- The install-to-register rate (a whopping 54.0%—also the highest of all sub-categories) indicates this is an audience primed for engagement—albeit at a higher price tag ($10.39) that comes in 13.3% higher than the overall gaming apps category ($9.17).
- At $39.33, the cost to acquire a user who completes an in-app purchase is pricey (and once again higher than the price tag for all gaming apps). However, the conversion rate (14.3%) is also the highest of all sub-categories and higher than the rate for all gaming apps (12.3%).
The install-to-register rate indicates this is an audience primed for engagement albeit at a higher price tag that comes in 13.3% higher than the overall gaming apps category.
Users are interested but game concepts may need a rethink
Social Casino Gaming Apps Costs & Conversion Rates YoY
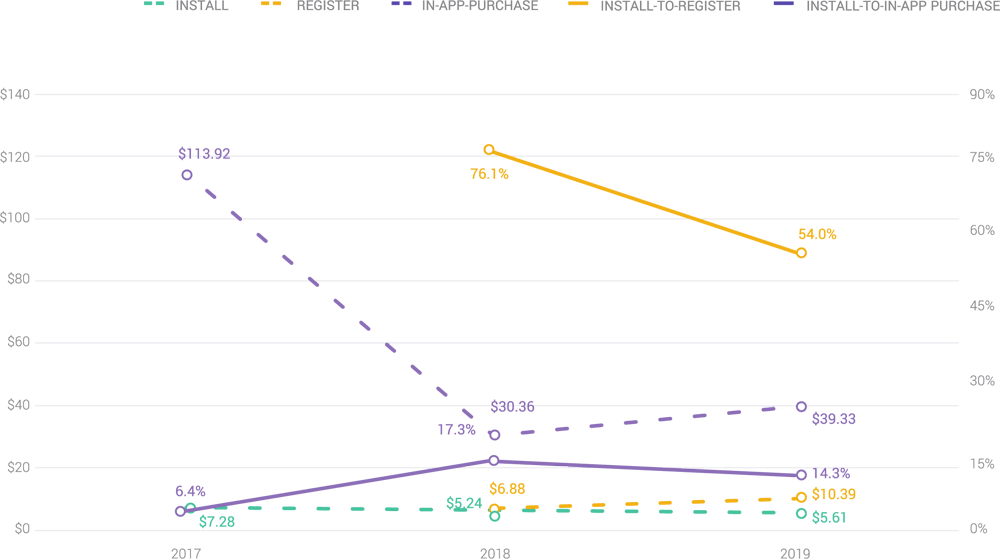
- Stable CPIs support reams of research that suggest Social Casino games are a safe bet, but costs deeper in the funnel are increasing, suggesting UA campaigns and game concepts might benefit from a rethink.
- In just one year, register costs increased by 51.0% to reach $10.39, and the price to acquire a user who completes an in-app purchase increased a sizeable 29.5% to hit $39.33.
- Unfortunately, increased costs are not a match with conversion rates. The install-to-in-app purchase rate fell 3 percentage points (or 17.3%) to level out at 14.3%.
You get what you pay for—but should marketers cast a wider net?
Social Casino Gaming Apps Install Costs by Region
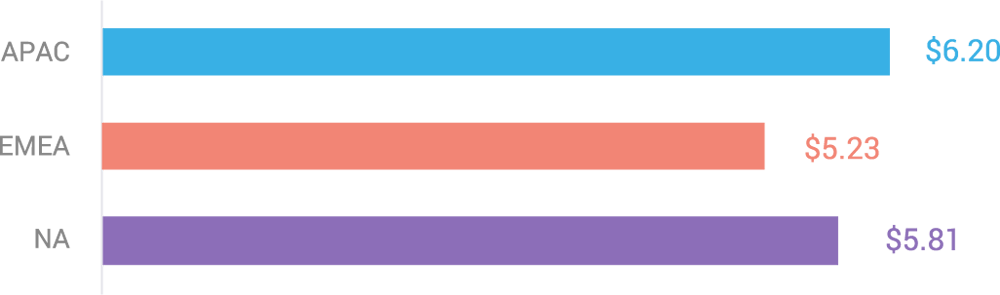
Social Casino games are generally more popular in the West than in Asia, and are especially popular in North America, according to Newzoo. This pattern is mirrored perfectly in the data that shows CPIs in North America (though pricey at $5.81) are 6.3% cheaper than installs in APAC ($6.20). However, it may be that marketers should focus efforts on EMEA, a market that shares similar cultural preferences with North America at a price ($5.23) that is 10.0% lower.
Is EMEA the “sleeping giant” of Social Casino games?
Social Casino Gaming Apps Register & Purchase Costs & Conversions by Region
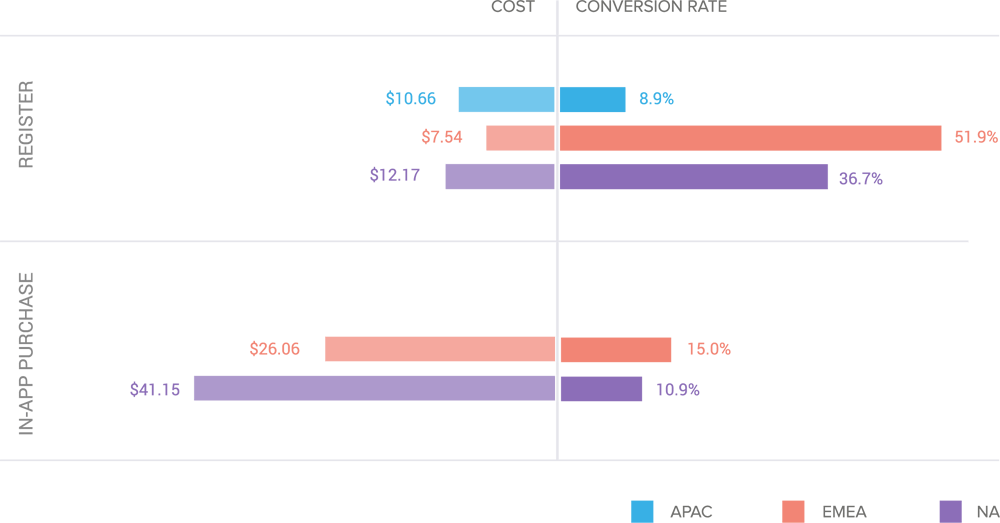
- At the middle of the funnel, the cost to acquire a user who completes a registration is the most expensive in North America ($12.17) followed by APAC ($10.66).
- EMEA appears to be a steal at $7.54 (38.0% cheaper than North America, where Social Casino games are incredibly popular and carry the price to match).
- EMEA conversion rates for register (51.9%) and in-app purchase (15.0%) are attractive and significantly higher than North America (41.4% and 37.6% respectively).
EMEA conversion rates for register (51.9%) and in-app purchase (15.0%) are attractive and significantly higher than North America (41.4% and 37.6% respectively).

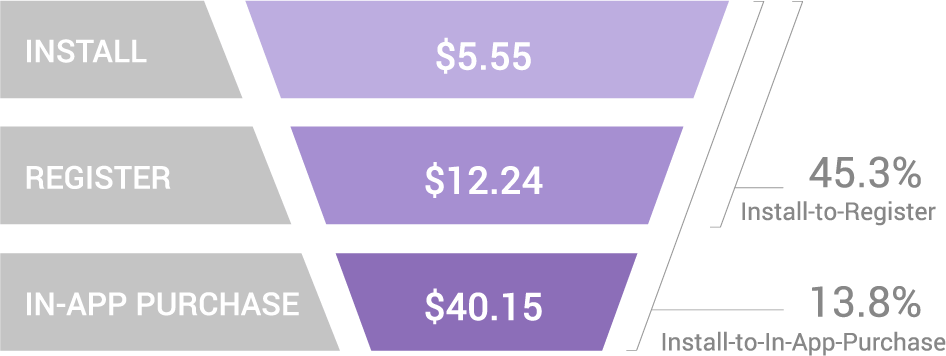
U.S. deep-dive
In-app purchase costs ($40.15) are a tick more expensive than the overall subcategory ($39.33). The in-app purchase conversion rate (13.8%) is 3.50% less than the average (14.3%), indicating that new campaigns and concepts may be needed to spark interest in gameplay.
USA Social Casino Gaming Apps Costs
& Conversion Rates
![]()
Apptopia data pegs downloads of Social Casino gaming apps in the U.S. at 18,169,545, generating $481,577,825 in in-app purchase revenue.
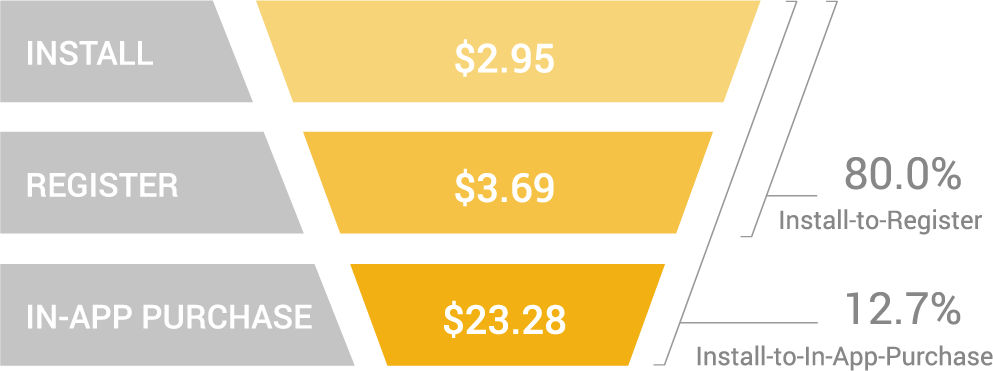
Russia deep-dive
In Russia, costs and conversion rates combine to tell a spectacularly positive story. At just $2.95, CPIs are an incredibly 47.4% cheaper than the price tag for the overall sub-category ($5.61).
The cost to acquire a user who makes an in-app purchase ($23.28) is a bargain, 40.8% cheaper than the average ($39.33). However, install-to-in-app purchase conversion rates (12.7%) are 11.2% lower than the overall sub-category (14.3%).
Russia Social Casino Gaming Apps Costs
& Conversion Rates
![]()
Apptopia data pegs downloads of Social Casino gaming apps in the Russia at 1,024,937, generating $1,270,666 in in-app purchase revenue.
Social Casino gaming apps crack the code on user engagement
Social Casino Gaming Apps User Retention
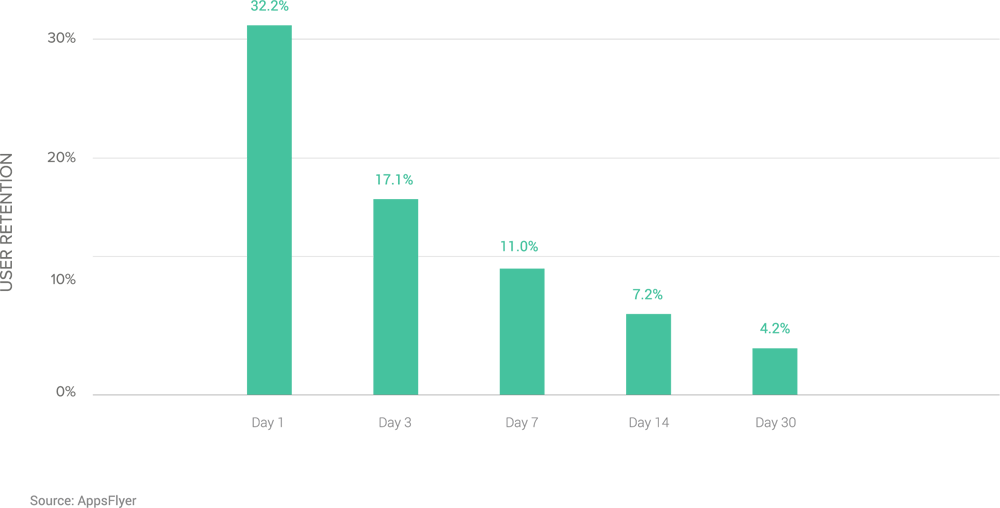
- At 32.2%, the retention rate mirrors the level of passion users have for this sub-category. It’s no coincidence this is similar to Hyper Casual, a gaming genre that hooks users with irresistible gameplay and instant satisfaction.
- It’s a fascination that lingers, creating positive conditions for efforts to re-engage users, stopping churn before it starts. At Day 3 retention is 17.1%, the highest of all subcategories examined in this report.
- Significantly, it’s the same situation at the all-important Day 30, when the retention rate (4.2%) is nearly 2x that of Hyper Casual (2.3%) and 50% higher than Casual (2.8%).
Social Casino gaming apps are crowd-pleasers in North America and EMEA
Social Casino Gaming Apps User Retention by Region
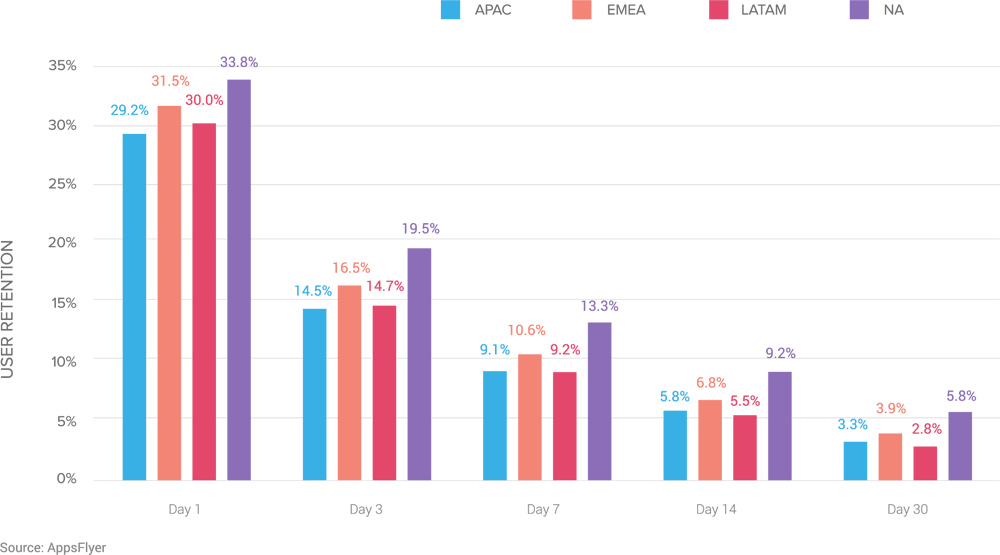
- Unsurprisingly, engagement among users in North America is impressive and consistent, kicking off on Day 1 at 33.8%. The decline from Day 3 onward is gradual, dropping by 31.8% from Day 3 to Day 7. The retention rate on Day 30 (5.8%) is 38.1% higher than overall retention for the sub-category (4.2%).
- EMEA is the fast follower, coming in at every stage with solid retention rates that keep pace with the overall retention for the sub-category, indicating users in the region are receptive and primed to engage.
- Retention rates in LATAM and APAC are nearly a mirror image of each other at every stage. This shifts on Day 30, when the retention rate in APAC (3.3%) surpasses LATAM (2.8%).
North America is a win, EMEA is a safe bet
Social Casino Gaming Apps User Retention by Country
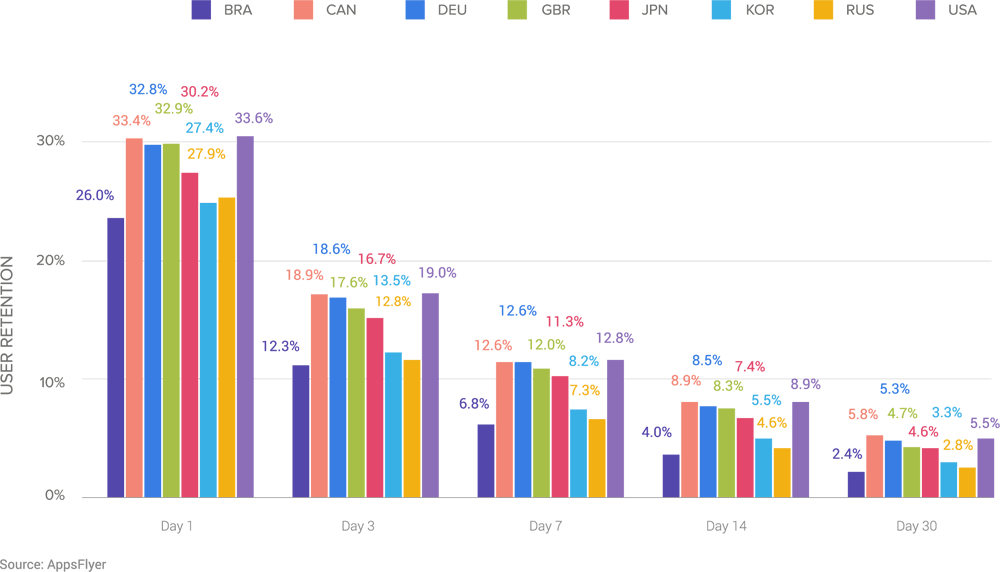
- Predictably, the U.S. and Canada lead the pack with the highest retention rates at every stage. But rather than join the party in North America, marketers might be well advised to explore other markets and tap less crowded (yet very attractive) market opportunities in EMEA.
- At the low end of the scale, Brazil has the lowest retention rate from Day 1 (26.0%), a pattern that continues through to Day 30.
- Japan (27.9%) and Korea (27.4%) start with similar rates on Day 1, but Japan shows the stronger retention rates from there on. Significantly, the Day 14 retention rate (7.4%) ties with the overall rate for the sub-category (7.2%).
![]()
Liftoff is a performance-based mobile app marketing and retargeting platform which uses post-install user data to run true cost-per-action user acquisition and re-engagement campaigns. Powered by advanced machine learning and lookalike targeting, Liftoff campaigns are optimized to drive actions beyond the install, like booking a hotel, making a reservation, or renewing a subscription. Liftoff’s cost-per-action model helps customers scale and grow by acquiring users that actively spend in revenue-producing events. Headquartered in Palo Alto, CA with offices in New York, London, Singapore, Tokyo, South Korea and Paris, Liftoff works with leading app publishers and brands across the globe.