
NEW! 2019 Mobile Shopping Apps Report
Shopping apps are soaring in use and popularity, but competition for mindshare and share of wallet is also on the rise. To ensure your shopping app makes the cut, marketers must turn every session into an opportunity to drive usage, boost loyalty and prime purchases.
In partnership with Adjust, the 2019 Mobile Shopping Apps Report delivers valuable user acquisition trends and benchmarks, including deep-funnel goals and analysis of retention data.
This report is also offered in Japanese, Chinese, Korean and Indonesian.
The report draws from Liftoff internal data from April 1, 2018, through March 31, 2019 — spanning 90.9 billion ad impressions across 13.6 million installs and 3.9 million in-app events.
We analyze costs and conversion rates globally, breaking down key engagement activities and trends to compare performance across regions (APAC, EMEA, LATAM and North America) and deep dive into five countries (Germany, Indonesia, Japan, the U.S and the U.K.). The report offers additional granularity, breaking down shopping apps into three distinct categories (Brand Commerce, Marketplace and Value-Add) and analyzing seasonality, suggesting ways marketers can adjust their strategy now that shopping apps have become an integral part of our daily routine and are less impacted by seasonality. It also reveals the precise amount of time (measured in hours and minutes) it takes for a user who installed a shopping app to make a first purchase.
Executive Summary
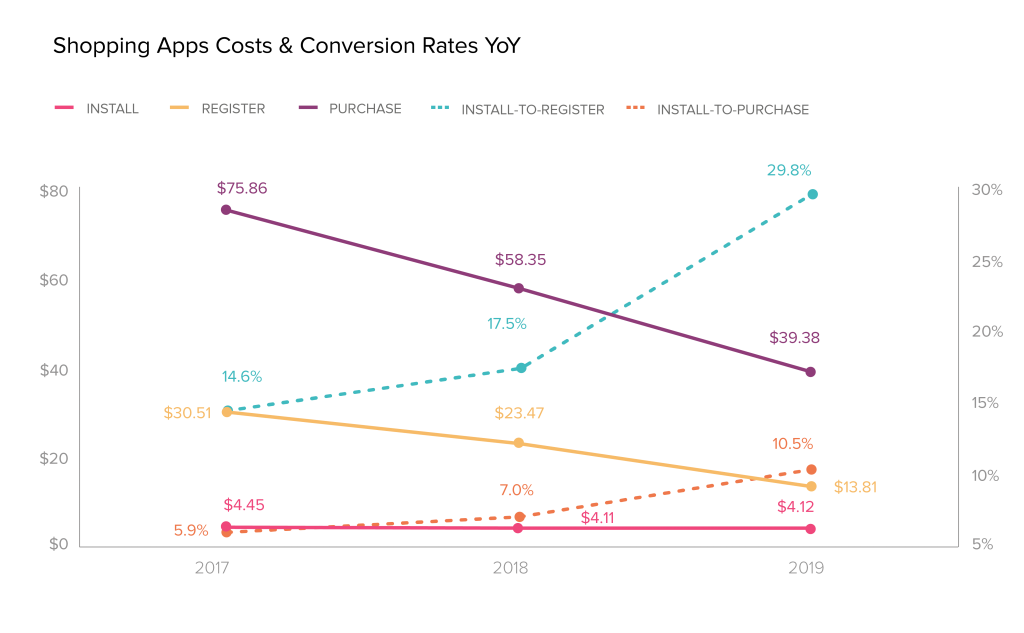
- Overall, shopping app users are more affordable to acquire and more apt to engage than ever before. The cost to acquire a user who makes a purchase is down nearly one-third compared to the previous year. Double-digit increases in conversion rates (in some cases nearly 50%) show users are primed for a purchase.
- Topline numbers indicate Brand Commerce and Value-Add apps are losing their grip. It could be tired creatives or poor UX, and marketers should perform an audit to find the disconnect. Marketplace apps enjoy the competitive edge, but should encourage loyalty — not rest on their laurels.
- From Singles’ Day to Mother’s Day, and from Cyber Monday to Super Bowl Sunday, consumer interest in shopping is continuous. Consumers are always shopping — so the practice of linking campaigns to seasonality and shopping events is somewhat passè.
- Users install shopping apps with a purpose. Retention starts high and tapers off over time, but loyalty doesn’t drop off a cliff overnight. It takes a full week for the retention rate to drop to 14%.
- A breakdown of data by region reveals install costs are lowest in APAC, while install-to-purchase rates are highest in EMEA. Users in more mature markets (APAC and North America) are a tough nut to crack.
- A review of costs and conversions across five key countries (Germany, Indonesia, Japan, the U.K. and the U.S.) shows Indonesia offers the lowest cost and the second highest install-to-purchase rate (trailing the U.K.).
As the second half of 2019 opens lucrative opportunities for mobile shopping app marketers to acquire heavy-thumbed mobile shoppers, knowing where (and when) to adjust the levers will be key to successfully round out the year and meet goals. For deeper insights and 2019 mobile shopping benchmarks, download the full report or watch our on-demand Marketing Shopping Apps: Strategies From Marketing Experts webinar.