NEW! 2019 Mobile Gaming Apps Report

Mobile gaming apps continue to grow at a fast and furious pace, set to reach 60% market share in consumer gaming spend in 2019. In partnership with AppsFlyer, the 2019 Mobile Gaming Apps Report delivers valuable user acquisition trends and benchmarks by mobile gaming sub-category, including in-app conversion rates and retention data.
This report is offered in English, Japanese and Chinese.
The report draws from Liftoff internal data from April 1, 2018, through March 31, 2019 — spanning 90.9 billion ad impressions across 13.6 million installs and 3.9 million in-app events.
In this report you’ll find an analysis of gaming app platform and seasonal trends, regional insights across North America, EMEA and APAC, and a deep dive into Midcore & Strategy, Casual Gaming, Hyper Casual
Key Takeaways
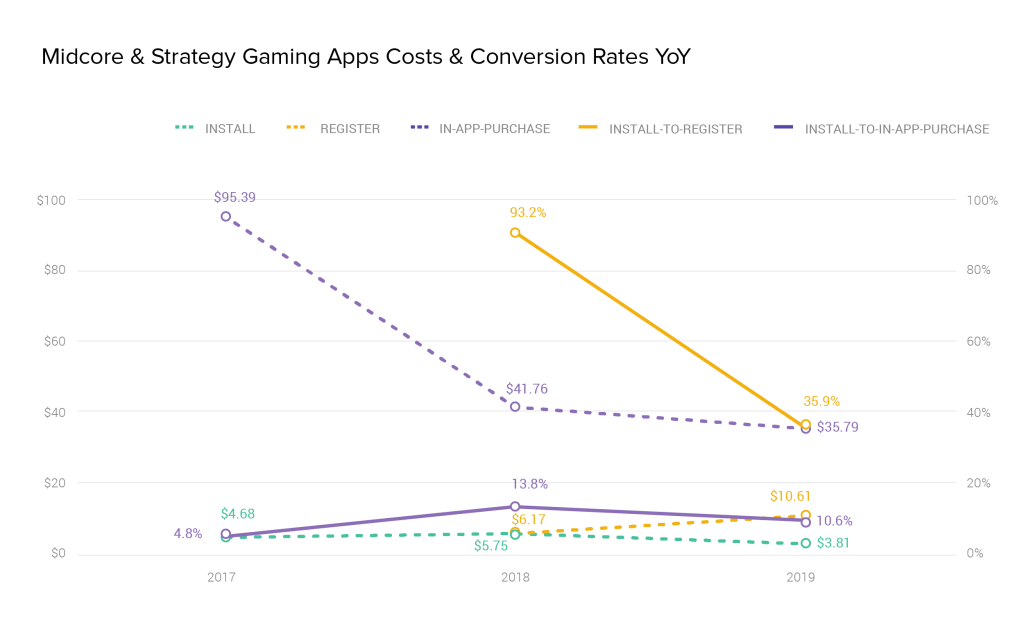
- Prepare for a perfect storm of marketing conditions. Moderate increases in costs and impressive double-digit conversion rates indicate that users still need some convincing early in the funnel, but they are willing to pay, play and stay around—particularly if the sub-category offers a habit-forming core loop.
- Competition heats up but summer months could give you the edge. A strategy to target users in the summer months from July to September can pay dividends. It’s during this period that the install-to-in-app conversion rate (16.0%) hits its second-highest point and the cost to acquire a new user who makes an in-app purchase hits a low of $27.09.
- Don’t just play it safe in mature markets; explore untapped opportunities in APAC and Europe. North America may be a textbook model for robust growth in the mobile gaming apps market, but the data also reveals several countries where potential is huge while the costs are not. Russia, in particular, stands out as a country that embraces Casual and Social Casino games offering insanely affordable CPIs and eye-watering install-to-registration rates. Japan also merits a closer look, showing the highest interest and commitment to Casual games and a healthy appetite for Hyper Casual. Finally, EMEA—specifically Germany and the U.K.—is a region that offers lower costs and a healthier retention curve for Midcore & Strategy games
. Social Casino has staying power & Hyper Casual has users hooked. Day 1 retention is highest for Social Casino (32.2%) and Hyper Casual (32.7%) games, but it’s Social Casino that maintains momentum into Day 30. But retention rates for three sub-categories (Casual, Hyper Casual and Midcore & Strategy) narrow at Day 7 and again on Day 14, indicating that audiences for these games are equally engaged, and, perhaps, equally receptive to campaigns and messaging that nudge them to return to the game and play more often.
For deeper insights and 2019 mobile gaming app benchmarks, download the full report or register for our on-demand webinar Marketing Mobile Games: Insider Stories on Scaling Growth.
This report has also been covered by Dean Takahashi, lead writer for GamesBeat at VentureBeat.