2018 Mobile Shopping Apps Report Analysis: Monthly Trends
Liftoff’s recent Mobile Shopping Apps Report examines the latest user acquisition trends and benchmarks to assist e-commerce marketers. While interest in shopping apps is continuous throughout the year, our data highlights some of the best times of year to invest in marketing shopping apps.
Purchase Cost & Conversion Trends
In addition to the traditional winter holiday shopping season, fall is the most profitable time of year for e-commerce app marketers — when user acquisition costs are at their lowest and install-to-purchase rates are at their highest. These trends actually start off in August, when families are focused on returning to school and getting back to a regular routine. It is the beginning of a significant post-install purchase curve that continues throughout the holiday season.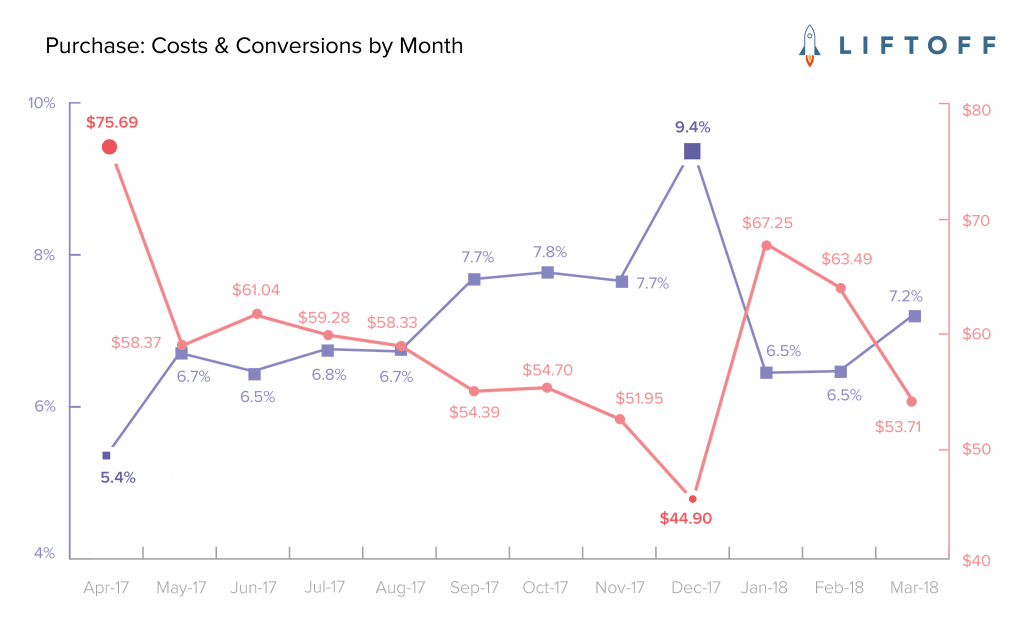
Starting at 6.7% in August, the install-to-purchase rate rises to a high of 9.4% in December. At the same time, the cost per first purchase steadily declines from $58.33 in August to a low of $44.90 in December. Combined with a high install-to-purchase conversion rate, this time of year creates a perfect storm for ecommerce marketers.
Registration Cost & Conversion Trends
Looking higher in the shopping app funnel, the install-to-registration rate peaked in September at 20.4%, while the cost to acquire someone who registers in a shopping app dropped to an annual low of $20.52. This, again, suggests that fall is a favorable time of year for e-commerce marketers to invest in user acquisition.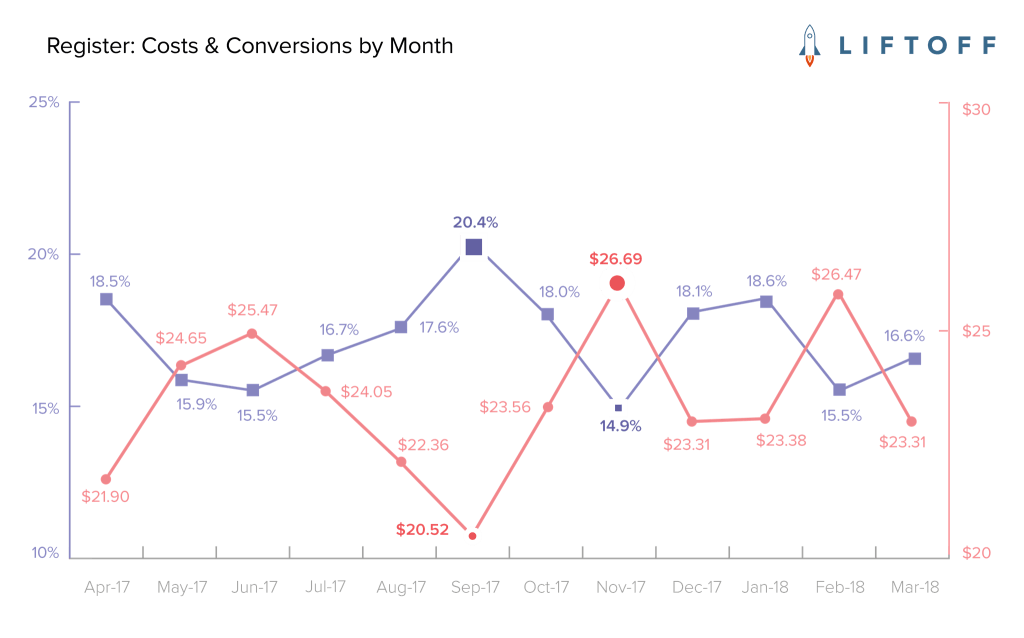
To get the best return on your mobile marketing dollars, expand your user acquisition and re-engagement efforts beyond the traditional shopping holiday period. With the proliferation of mobile shopping apps, we know that shopping is a year-round activity (which the report highlights as 6 shopping seasons).
Download the full report for deeper insights on the best times of year to market your shopping app and acquire engaged mobile shoppers.
The 2018 Mobile Shopping Apps Report arms mobile shopping app marketers to know when and how to market their app most effectively. It draws from Liftoff internal data from April 2017 through April 2018, spanning 58.1 billion ad impressions across 10.2 million app installs, and 1.8 million first registrations and purchases.